


本文绘制直方图使用的数据集为Iris,下载地址在http://archive.ics.uci.edu/ml/。
from matplotlib import pyplot as plt
'''
count of Petal width
'''
file=open("../dataset/iris.txt", "r")
content = [x.rstrip("\n") for x in file]
file.close()
d_sl=[]
while '' in content:
content.remove('')
data_slength = [x.split(',')[3] for x in content[0:]]
while '' in data_slength:
data_slength.remove('')
for i in data_slength:
d_sl.append(float(i))
plt.hist(d_sl,10,alpha=0.5)
plt.xlabel("Petal width")
plt.ylabel("count")
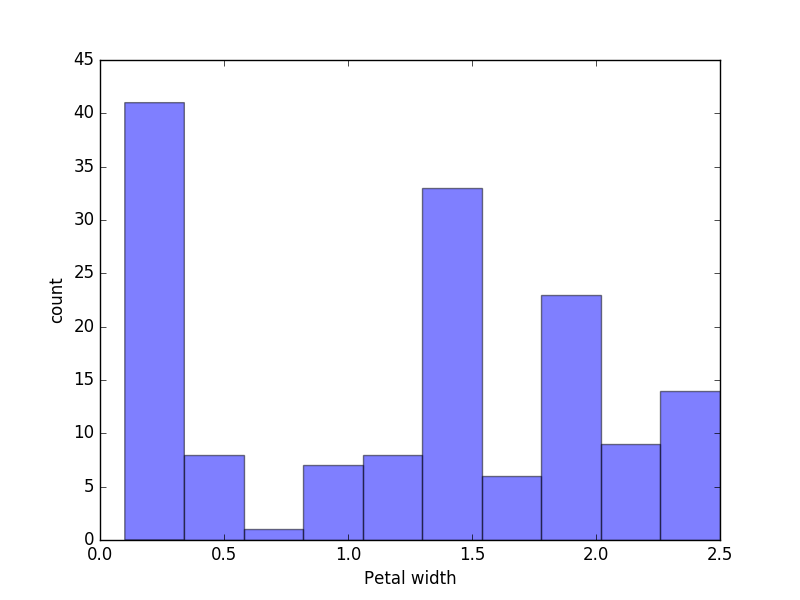
plt.show()这里以Petal width为例,绘制结果如下:


 4296
4296

 被折叠的 条评论
为什么被折叠?
被折叠的 条评论
为什么被折叠?
 到【灌水乐园】发言


