


文章目录
1. 前言
限于作者能力水平,本文可能存在谬误,因此而给读者带来的损失,作者不做任何承诺。
2. 什么是 Dynamic debug (dyndbg) ?
Dynamic debug(dyndbg) 功能,简单来讲,就是允许用户空间通过 debugfs 导出的文件节点 /sys/kernel/debug/dynamic_debug/control,动态的、在运行时控制 Linux 内核 KERN_DEBUG 类型日志的开启和关闭。在没开启 Dynamic debug 时,直到下次重新编译内核做出改变之前,内核 KERN_DEBUG 类型日志要么一直关闭,要么一直开启,无法在运行时做出调整。
3. Dynamic debug (dyndbg) 的使用
3.1 开启 Dynamic debug (dyndbg) 功能
来看 Linux 内核配置文件 lib/Kconfig.debug 中,配置项 CONFIG_DYNAMIC_DEBUG 的定义:
config DYNAMIC_DEBUG
        bool "Enable dynamic printk() support"
        default n
        depends on PRINTK
        depends on DEBUG_FS
        help

          Compiles debug level messages into the kernel, which would not
          otherwise be available at runtime. These messages can then be
          enabled/disabled based on various levels of scope - per source file,
          function, module, format string, and line number. This mechanism
          implicitly compiles in all pr_debug() and dev_dbg() calls, which
          enlarges the kernel text size by about 2%.

          If a source file is compiled with DEBUG flag set, any
          pr_debug() calls in it are enabled by default, but can be
          disabled at runtime as below.  Note that DEBUG flag is
          turned on by many CONFIG_*DEBUG* options.

          Usage:

          ......
要开启 Dynamic debug 功能,要开启配置项 CONFIG_DYNAMIC_DEBUG,其依赖于配置项 CONFIG_PRINTK 和 CONFIG_DEBUG_FS。由于最终调用的打印接口都是 printk(),所以要开启 CONFIG_PRINTK;另外 Dynamic debug 通过 debugfs 导出的文件节点 /sys/kernel/debug/dynamic_debug/control 控制每个 KERN_DEBUG 调试语句,所以需要启用 CONFIG_DEBUG_FS 。
学习一样技能,最好先学会如何使用它,这往往是一个不错的起点。本文采用 QEMU + vexpress-a9 + Linux 4.14.132 + ubuntu-base-16.04-core-armhf.tar.gz 组合来进行 Dynamic debug 功能测试。如何使用 QEMU 搭建需要的测试环境,不在本文的讨论范围之内,读者可以自行查询相关资料或去笔者的 Gitee 仓库 去拿一个构建脚本。
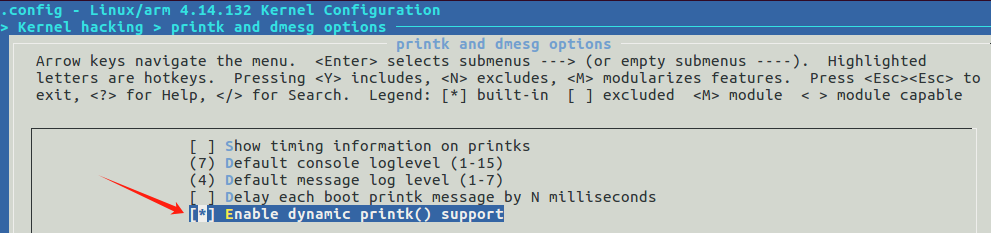
开启 CONFIG_DYNAMIC_DEBUG 和其依赖配置项 CONFIG_PRINTK 和 CONFIG_DEBUG_FS。这里只展示 CONFIG_DYNAMIC_DEBUG 的开启,CONFIG_PRINTK 和 CONFIG_DEBUG_FS 默认处于开启状态。
$ cd linux-4.14.132
$ make ARCH=arm CROSS_COMPILE=arm-linux-gnueabi- O=output menuconfig
然后编译运行内核:
$ cd linux-4.14.132
$ make ARCH=arm CROSS_COMPILE=arm-linux-gnueabi- O=output -j8
$ cd ..
$ sudo qemu-system-arm \
     -M vexpress-a9 -smp 4 -m 512M \
     -kernel linux-4.14.132/output/arch/arm/boot/zImage \
     -dtb linux-4.14.132/output/arch/arm/boot/dts/vexpress-v2p-ca9.dtb \
     -nographic \
     -append "root=/dev/mmcblk0 rw rootfstype=ext4 console=ttyAMA0" \
     -sd rootfs/arm-ubuntu-16.04.img
其中,rootfs/arm-ubuntu-16.04.img 是根文件系统,可通过前面笔者提供的脚本构建,或者读者自行查阅相关资料。运行并登录后,查看 /sys/kernel/debug 目录,会发现一个名为 dynamic_debug 的目录,目录下有一个 control 文件:
root@qemu-ubuntu:~# ls /sys/kernel/debug/ -l
......
drwxr-xr-x  2 root root 0 Jan  1  1970 dynamic_debug
......
root@qemu-ubuntu:~# ls /sys/kernel/debug/dynamic_debug/ -l
total 0
-rw-r--r-- 1 root root 0 Jan  1  1970 control
可以看到,文件 /sys/kernel/debug/dynamic_debug/control 具有可读写权限,读下它看它包含些什么内容:
root@qemu-ubuntu:~# cat /sys/kernel/debug/dynamic_debug/control
# filename:lineno [module]function flags format
init/main.c:743 [main]initcall_blacklist =p "blacklisting initcall %s\012"
init/main.c:774 [main]initcall_blacklisted =p "initcall %s blacklisted\012"
init/initramfs.c:485 [initramfs]unpack_to_rootfs =_ "Detected %s compressed data\012"
arch/arm/vfp/vfpmodule.c:300 [vfp]vfp_emulate_instruction =_ "VFP: emulate: INST=0x%08x SCR=0x%08x\012"
[......]
lib/kobject_uevent.c:392 [kobject_uevent]kobject_uevent_env =_ "kobject: '%s' (%p): %s: unset subsystem caused the event to drop!\012"
lib/kobject_uevent.c:434 [kobject_uevent]kobject_uevent_env =_ "kobject: '%s' (%p): %s: uevent() returned %d\012"
输出内容实在有点太多了,这里只截取一部分。对于每行输出内容的格式,第一行给出了注释:
# filename:lineno [module]function flags format
用这个格式解释下第二行内容:
init/main.c:743 [main]initcall_blacklist =p "blacklisting initcall %s\012"
filename => init/main.c
lineno => 743
[module]function => [main]initcall_blacklist
flags => =p
format => "blacklisting initcall %s\012"
让人很好奇不是,文件 init/main.c 的 743 行,函数 initcall_blacklist() 到底包含是什么内容?来看一下:
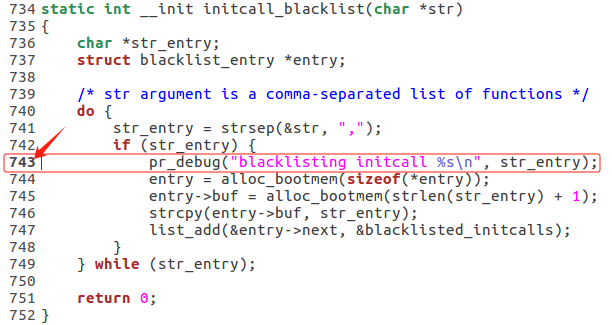
都猜到了吧?正是一个 pr_debug() 调用。
3.2 使用 Dynamic debug (dyndbg) 功能
读 /sys/kernel/debug/dynamic_debug/control 文件,将列举内核中当前可通过写 control 文件使能、关闭的调试语句信息。对 control 文件的读、写分别代表不同的含义。对 control 文件写入操作的语法如下:
command ::= match-spec* flags-spec

match-spec ::= 'func' string |
               'file' string |
               'module' string |
               'format' string |
               'line' line-range

line-range ::= lineno |
               '-'lineno |
               lineno'-' |
               lineno'-'lineno

lineno ::= unsigned-int

// 对于 flags-spec,内核文档不知道是不是漏掉了,
// 这里是笔者给出的定义,不太准确,读者能理解意思即可。
flags-spec ::= flag-ops flags
flags-ops ::= - | + | =
flags ::= p | f | l | m | t | _
对 flags 支持如下 flag-ops 操作,包括 - (移除)、+ (添加)、= (赋值):
-    remove the given flags
+    add the given flags
=    set the flags to the given flags
有下列可选 flags :
p    enables the pr_debug() callsite.
f    Include the function name in the printed message
l    Include line number in the printed message
m    Include module name in the printed message
t    Include thread ID in messages not generated from interrupt context
_    No flags are set. (Or'd with others on input)
由于内核原有代码的 pr_debug(), dev_debug() 等调试语句,要依赖一定条件才能触发,对于演示 Dynamic debug 功能的使用不是很方便,也不够直观,所以本文通过编写一个测试模块来演示 Dynamic debug 功能的使用。Dynamic debug 功能测试模块的代码 dynamic_debug_example.c 如下:
#include <linux/module.h>
#include <linux/sched.h>
#include <linux/kthread.h>
#include <linux/delay.h>


static struct task_struct *dyndbg_tsk;


static int dyndbg_task_fn(void *ignored)
{
	int count = 0;
	int ret = 0;

	while (!kthread_should_stop()) {
		pr_debug("dyndbg test message %d\n", count++);
		msleep(2000);
	}

	return ret;
}

static int __init dyndbg_test_init(void)
{
	int ret = 0;

	printk(KERN_INFO "dyndbg test module init.\n");

	dyndbg_tsk = kthread_run(dyndbg_task_fn, NULL, "dyndbg_test");
	if (IS_ERR(dyndbg_tsk)) {
		ret = PTR_ERR(dyndbg_tsk);
		printk(KERN_ERR "%s: Failed to create kernel thread, ret = [%d]\n",
			__func__, ret);
	}

	return ret;
}


module_init(dyndbg_test_init);
module_exit(dyndbg_test_exit);

MODULE_LICENSE("GPL");
编译模块并添加到根文件系统镜像,然后启动 QEMU 运行:
root@qemu-ubuntu:~# lsmod
Module                  Size  Used by
root@qemu-ubuntu:~# cat /sys/kernel/debug/dynamic_debug/control | grep "dynamic_debug_example"
通过查看 control 文件,没有看到关于测试模块 dynamic_debug_example.c 的任何信息,这是因为测试模块还没有加载,加载模块后再来看一下:
root@qemu-ubuntu:~# modprobe dynamic_debug_example
root@qemu-ubuntu:~# lsmod
Module                  Size  Used by
dynamic_debug_example    16384  0
root@qemu-ubuntu:~# cat /sys/kernel/debug/dynamic_debug/control | grep "dynamic_debug_example"
samples/dynamic_debug/dynamic_debug_example.c:16 [dynamic_debug_example]dyndbg_task_fn =_ "dyndbg test message %d\012"
看看,samples/dynamic_debug/dynamic_debug_example.c 已经出现在 control 的读输出中了。但是查看当前的内核日志,还是没发现测试模块的日志:
root@qemu-ubuntu:~# dmesg | grep "dyndbg test message"
我们注意到,control 的读输出中关于 dynamic_debug_example.c 的信息中,带有 =_ 标记,这表示 dynamic_debug_example.c 文件中第 16 行的 pr_debug() 没有开启。是时候施展魔法标记 +p 来开启这个调试语句,来看看效果:
root@qemu-ubuntu:~# echo -n "file samples/dynamic_debug/dynamic_debug_example.c +p" > /sys/kernel/debug/dynamic_debug/control

root@qemu-ubuntu:~# dmesg | tail -n 8
[ 1677.219423] dyndbg test message 2
[ 1679.410816] dyndbg test message 3
[ 1681.580533] dyndbg test message 4
[ 1683.792157] dyndbg test message 5
[ 1686.052255] dyndbg test message 6
[ 1688.202825] dyndbg test message 7
[ 1690.373784] dyndbg test message 8
[ 1692.562494] dyndbg test message 9

root@qemu-ubuntu:~# cat /sys/kernel/debug/dynamic_debug/control | grep "dynamic_debug_example"
samples/dynamic_debug/dynamic_debug_example.c:16 [dynamic_debug_example]dyndbg_task_fn =p "dyndbg test message %d\012"
可以看到,现在有了测试模块的日志;另外,读 control 文件的输出, dynamic_debug_example.c 第 16 行调试语句的标志已经变为了 =p 了,证明已经开启了。
嗯,越打越多,有点烦人,通过 -p 标记关闭这个调试语句:
root@qemu-ubuntu:~# echo -n "file samples/dynamic_debug/dynamic_debug_example.c -p" > /sys/kernel/debug/dynamic_debug/control
root@qemu-ubuntu:~# cat /sys/kernel/debug/dynamic_debug/control | grep "dynamic_debug_example"
samples/dynamic_debug/dynamic_debug_example.c:16 [dynamic_debug_example]dyndbg_task_fn =_ "dyndbg test message %d\012"
查看调试语句的标记已经变为 =_ 了,同时也确实没有日志输出了。通过 +pflm 标记玩一个花一点的输出:
root@qemu-ubuntu:~# echo -n "file samples/dynamic_debug/dynamic_debug_example.c +pflm" > /sys/kernel/debug/dynamic_debug/control
[ 2287.948918] dynamic_debug_example:dyndbg_task_fn:16: dyndbg test message 158
[ 2290.159226] dynamic_debug_example:dyndbg_task_fn:16: dyndbg test message 159
[ 2292.440786] dynamic_debug_example:dyndbg_task_fn:16: dyndbg test message 160
[ 2294.640683] dynamic_debug_example:dyndbg_task_fn:16: dyndbg test message 161
[ 2296.801579] dynamic_debug_example:dyndbg_task_fn:16: dyndbg test message 162
root@qemu-ubuntu:~# cat /sys/kernel/debug/dynamic_debug/control | grep "dynamic_debug_example"
samples/dynamic_debug/dynamic_debug_example.c:16 [dynamic_debug_example]dyndbg_task_fn =pmfl "dyndbg test message %d\012"
root@qemu-ubuntu:~# echo -n "file samples/dynamic_debug/dynamic_debug_example.c -pflm" > /sys/kernel/debug/dynamic_debug/control
在 +pflm 标记的加持下,调试日志相对之前的输出,增加了 模块名(+m)、函数名(+f)、行号(+l) 的输出。
本文对 Dynamic debug 输出的示范,就演示到此。关注 Dynamic debug 输出更多用法的读者,可参考 Linux 内核文档 Dynamic debug 。
4. Dynamic debug (dyndbg) 的实现
4.1 内核接口 dynamic_pr_debug() 的实现
对于 Linux 内核的 Dynamic debug 功能,我们可能既熟悉又陌生。来看下 include/linux/printk.h 和 include/linux/device.h 中的相关定义:
/* include/linux/printk.h */

/* If you are writing a driver, please use dev_dbg instead */
#if defined(CONFIG_DYNAMIC_DEBUG)
#include <linux/dynamic_debug.h>

/* dynamic_pr_debug() uses pr_fmt() internally so we don't need it here */
#define pr_debug(fmt, ...) \
	dynamic_pr_debug(fmt, ##__VA_ARGS__)
#elif defined(DEBUG)
#define pr_debug(fmt, ...) \
	printk(KERN_DEBUG pr_fmt(fmt), ##__VA_ARGS__)
#else
#define pr_debug(fmt, ...) \
	no_printk(KERN_DEBUG pr_fmt(fmt), ##__VA_ARGS__)
#endif
/* include/linux/device.h */

#if defined(CONFIG_DYNAMIC_DEBUG)
#define dev_dbg(dev, format, ...)		     \
do {						     \
	dynamic_dev_dbg(dev, format, ##__VA_ARGS__); \
} while (0)
#elif defined(DEBUG)
#define dev_dbg(dev, format, arg...)		\
	dev_printk(KERN_DEBUG, dev, format, ##arg)
#else
#define dev_dbg(dev, format, arg...)				\
({								\
	if (0)							\
		dev_printk(KERN_DEBUG, dev, format, ##arg);	\
})
#endif
从上面 pr_debug() 和 dev_dbg() 定义看到,开启 Dynamic debug 的情形下(即配置 CONFIG_DYNAMIC_DEBUG=y),pr_debug() 实现为 dynamic_pr_debug(),dev_dbg() 实现为 dynamic_dev_dbg(),这意味着:
1. Dynamic debug 只影响 KERN_DEBUG 类型的内核日志。
2. Dynamic debug 影响所有基于 pr_debug(), dev_dbg() 的 API 接口。
继续看 dynamic_pr_debug() 的实现细节:
/* include/linux/dynamic_debug.h */

#ifdef HAVE_JUMP_LABEL

#define dd_key_init(key, init) key = (init)

#ifdef DEBUG
#define DEFINE_DYNAMIC_DEBUG_METADATA(name, fmt) \
	DEFINE_DYNAMIC_DEBUG_METADATA_KEY(name, fmt, .key.dd_key_true, \
					  (STATIC_KEY_TRUE_INIT))

#define DYNAMIC_DEBUG_BRANCH(descriptor) \
	static_branch_likely(&descriptor.key.dd_key_true)
#else /* !DEBUG */
#define DEFINE_DYNAMIC_DEBUG_METADATA(name, fmt) \
	DEFINE_DYNAMIC_DEBUG_METADATA_KEY(name, fmt, .key.dd_key_false, \
					  (STATIC_KEY_FALSE_INIT))

#define DYNAMIC_DEBUG_BRANCH(descriptor) \
	static_branch_unlikely(&descriptor.key.dd_key_false)
#endif /* DEBUG */

#else /* !HAVE_JUMP_LABEL */

#define dd_key_init(key, init)

#define DEFINE_DYNAMIC_DEBUG_METADATA(name, fmt) \
	DEFINE_DYNAMIC_DEBUG_METADATA_KEY(name, fmt, 0, 0)

#ifdef DEBUG
#define DYNAMIC_DEBUG_BRANCH(descriptor) \
	likely(descriptor.flags & _DPRINTK_FLAGS_PRINT)
#else /* !DEBUG */
#define DYNAMIC_DEBUG_BRANCH(descriptor) \
	unlikely(descriptor.flags & _DPRINTK_FLAGS_PRINT)
#endif /* DEBUG */

#endif /* HAVE_JUMP_LABEL */

#define dynamic_pr_debug(fmt, ...)				\
do {								\
	DEFINE_DYNAMIC_DEBUG_METADATA(descriptor, fmt);		\
	if (DYNAMIC_DEBUG_BRANCH(descriptor))			\
		__dynamic_pr_debug(&descriptor, pr_fmt(fmt),	\
				   ##__VA_ARGS__);		\
} while (0)
把 dynamic_pr_debug() 的定义按 HAVE_JUMP_LABEL 和 DEBUG 的不同组合展开,得到如下 4 种可能的代码片段:
/* (1) HAVE_JUMP_LABEL && DEBUG */

static struct _ddebug  __aligned(8)
__attribute__((section("__verbose"))) descriptor = {
	.modname = KBUILD_MODNAME,
	.function = __func__,
	.filename = __FILE__,
	.format = (fmt),
	.lineno = __LINE__,
	.flags = _DPRINTK_FLAGS_PRINT,
	.key.dd_key_true = STATIC_KEY_TRUE_INIT, /* 调试语句 默认为 启用 状态 */
};
if (static_branch_likely(&descriptor.key.dd_key_true))
	__dynamic_pr_debug(&descriptor, pr_fmt(fmt), ##__VA_ARGS__);
/* (2) HAVE_JUMP_LABEL && !DEBUG */

static struct _ddebug  __aligned(8)
__attribute__((section("__verbose"))) descriptor = {
	.modname = KBUILD_MODNAME,
	.function = __func__,
	.filename = __FILE__,
	.format = (fmt),
	.lineno = __LINE__,
	.flags = 0,
	.key.dd_key_true = STATIC_KEY_FALSE_INIT, /* 调试语句 默认为 关闭 状态 */
};
if (static_branch_unlikely(&descriptor.key.dd_key_false))
	__dynamic_pr_debug(&descriptor, pr_fmt(fmt), ##__VA_ARGS__);
/* (3) !HAVE_JUMP_LABEL && DEBUG */

static struct _ddebug  __aligned(8)
__attribute__((section("__verbose"))) descriptor = {
	.modname = KBUILD_MODNAME,
	.function = __func__,
	.filename = __FILE__,
	.format = (fmt),
	.lineno = __LINE__,
	.flags = _DPRINTK_FLAGS_PRINT, /* 调试语句 默认为 启用 状态 */
};
if (likely(descriptor.flags & _DPRINTK_FLAGS_PRINT))
	__dynamic_pr_debug(&descriptor, pr_fmt(fmt), ##__VA_ARGS__);
/* (4) !HAVE_JUMP_LABEL && !DEBUG */

static struct _ddebug  __aligned(8)
__attribute__((section("__verbose"))) descriptor = {
	.modname = KBUILD_MODNAME,
	.function = __func__,
	.filename = __FILE__,
	.format = (fmt),
	.lineno = __LINE__,
	.flags = 0, /* 调试语句 默认为 关闭 状态 */
};
if (unlikely(descriptor.flags & _DPRINTK_FLAGS_PRINT))
		__dynamic_pr_debug(&descriptor, pr_fmt(fmt), ##__VA_ARGS__);
从上面的代码片段看到,内核为每个 pr_debug()(, dev_dbg()) 语句建立了一个 struct _ddebug 对象来管理它们,在编译时将 struct _ddebug 放置在名为 "__verbose" 的 section 内,在链接时通过 include/asm-generic/vmlinux.lds.h 如下链接脚本片段
/*
 * .data section
 */
#define DATA_DATA							\
	...... \
	/* implement dynamic printk debug */				\
	. = ALIGN(8);                                                   \
	VMLINUX_SYMBOL(__start___jump_table) = .;                       \
	KEEP(*(__jump_table))                                           \
	VMLINUX_SYMBOL(__stop___jump_table) = .;                        \
	. = ALIGN(8);							\
	VMLINUX_SYMBOL(__start___verbose) = .;                          \
	KEEP(*(__verbose))                                              \
	VMLINUX_SYMBOL(__stop___verbose) = .;				\
	......
将所有编译输出的、包含 struct _ddebug 的 "__verbose" section 全部放入区间 [__start___verbose, __stop___verbose) 内。这些信息的用途将在后面分析章节进一步讨论,这里暂不做展开。
从上面的 4 种不同配置组合的代码片段,dynamic_pr_debug() 的逻辑就很清楚了:通过判定一个标记,来决定是否调用 __dynamic_pr_debug() 打印调试输出。这 4 种组合,对于 HAVE_JUMP_LABEL 的场景 (1)、(2),通过 static_key 进行判定是否打印调试输出,其细节稍显复杂,对 static_key 实现感兴趣的读者,可自行查阅相关资料或参考博文 Linux: Jump label实现简析 ;而对于 !HAVE_JUMP_LABEL 场景 (3)、(4),则是一目了然,通过 descriptor.flags 进行判定是否打印调试输出。另外,这 4 种组合的 DEBUG 场景 (1)、(3) 默认使能调试输出,!DEBUG 场景 (2)、(4) 默认关闭调试输出。
最后看一下 __dynamic_pr_debug() 实现:
/* lib/dynamic_debug.c */

static char *dynamic_emit_prefix(const struct _ddebug *desc, char *buf)
{
	int pos_after_tid;
	int pos = 0;

	*buf = '\0';

	if (desc->flags & _DPRINTK_FLAGS_INCL_TID) { /* 't' 标记 */
		if (in_interrupt())
			pos += snprintf(buf + pos, remaining(pos), "<intr> "); /* 在中断上下文,用 "<intr>" 代替 线程 ID */
		else
			pos += snprintf(buf + pos, remaining(pos), "[%d] ", /* 线程 ID */
					task_pid_vnr(current));
	}
	pos_after_tid = pos;
	if (desc->flags & _DPRINTK_FLAGS_INCL_MODNAME) /* 'm' 标记 */
		pos += snprintf(buf + pos, remaining(pos), "%s:",
				desc->modname); /* 模块名 */
	if (desc->flags & _DPRINTK_FLAGS_INCL_FUNCNAME) /* 'f' 标记 */
		pos += snprintf(buf + pos, remaining(pos), "%s:",
				desc->function); /* 函数名 */
	if (desc->flags & _DPRINTK_FLAGS_INCL_LINENO) /* 'l' 标记 */
		pos += snprintf(buf + pos, remaining(pos), "%d:",
				desc->lineno); /* 行号 */
	if (pos - pos_after_tid)
		pos += snprintf(buf + pos, remaining(pos), " ");
	if (pos >= PREFIX_SIZE)
		buf[PREFIX_SIZE - 1] = '\0';

	return buf;
}

void __dynamic_pr_debug(struct _ddebug *descriptor, const char *fmt, ...)
{
	va_list args;
	struct va_format vaf;
	char buf[PREFIX_SIZE];

	BUG_ON(!descriptor);
	BUG_ON(!fmt);

	va_start(args, fmt);

	vaf.fmt = fmt;
	vaf.va = &args;

	/* 最终调用 printk() 输出 */
	printk(KERN_DEBUG "%s%pV", dynamic_emit_prefix(descriptor, buf), &vaf);

	va_end(args);
}
4.2 debugfs 导出控制节点 control 实现
4.2.1 Dynamic debug 初始化
/* lib/dynamic_debug.c */

static int __init dynamic_debug_init(void)
{
	struct _ddebug *iter, *iter_start;
	const char *modname = NULL;
	char *cmdline;
	int ret = 0;
	int n = 0, entries = 0, modct = 0;
	int verbose_bytes = 0;

	/*
	 * [__start___verbose, __stop___verbose):
	 * 为系列接口
	 * pr_debug() -> dynamic_pr_debug()
	 * dev_dbg() -> dynamic_dev_dbg()
	 * netdev_dbg() -> dynamic_netdev_dbg()
	 * print_hex_dump_bytes(), print_hex_dump_debug() -> dynamic_hex_dump()
	 * 每个调用定义的 struct _ddebug 对象列表。
	 */
	if (__start___verbose == __stop___verbose) {
		pr_warn("_ddebug table is empty in a CONFIG_DYNAMIC_DEBUG build\n");
		return 1;
	}
	iter = __start___verbose;
	modname = iter->modname;
	iter_start = iter;
	for (; iter < __stop___verbose; iter++) {
		entries++; /* dyndbg 调试语句总数 +1 */
		/* 非调试信息部分总长度: 模块名 + 函数名 + 文件名 + 格式字串 */
		verbose_bytes += strlen(iter->modname) + strlen(iter->function)
			+ strlen(iter->filename) + strlen(iter->format);

		if (strcmp(modname, iter->modname)) { /* 不同于当前模块 @modname 的 新模块 @iter->modname */
			modct++; /* 模块总数 +1 */
			/* 添加当前模块 @modname 到 模块表 @ddebug_tables */
			ret = ddebug_add_module(iter_start, n, modname);
			if (ret)
				goto out_err;
			/*
			 * 更新当前 dyndb 模块:
			 */
			n = 0; /* 复位当前模块包含的 dyndb 调试语句总数 */
			modname = iter->modname; /* 更新当前 dyndb 模块名 */
			iter_start = iter; /* 当前模块的首个 dyndb 调试语句信息对象 */
		}
		n++; /* 当前模块包含的 dyndb 调试语句总数 */
	}
	ret = ddebug_add_module(iter_start, n, modname); /* 添加最后一个 dyndb 模块 */
	if (ret)
		goto out_err;

	ddebug_init_success = 1; /* 标记 dyndb 初始化完成 */
	vpr_info("%d modules, %d entries and %d bytes in ddebug tables, %d bytes in (readonly) verbose section\n",
		 modct, entries, (int)(modct * sizeof(struct ddebug_table)),
		 verbose_bytes + (int)(__stop___verbose - __start___verbose));

	/* apply ddebug_query boot param, dont unload tables on err */
	/*
	 * 可通过内核命令行参数 ddebug_query="QUERY" 指定 BOOT 期间启用的调试语句。
	 * 如 ddebug_query="file xxx.c +p" 开启 xxx.c 中的所有 dyndbg 调试语句。
	 * 已废弃,内核不建议使用 ddebug_query="QUERY" 。
	 * ddebug_setup_string[] 设置见后面的分析。
	 */
	if (ddebug_setup_string[0] != '\0') {
		pr_warn("ddebug_query param name is deprecated, change it to dyndbg\n");
		ret = ddebug_exec_queries(ddebug_setup_string, NULL);
		if (ret < 0)
			pr_warn("Invalid ddebug boot param %s\n",
				ddebug_setup_string);
		else
			pr_info("%d changes by ddebug_query\n", ret);
	}
	/* now that ddebug tables are loaded, process all boot args
	 * again to find and activate queries given in dyndbg params.
	 * While this has already been done for known boot params, it
	 * ignored the unknown ones (dyndbg in particular).  Reusing
	 * parse_args avoids ad-hoc parsing.  This will also attempt
	 * to activate queries for not-yet-loaded modules, which is
	 * slightly noisy if verbose, but harmless.
	 */
	/*
	 * 处理内核命令行参数: dyndbg="QUERY", module.dyndbg="QUERY"
	 * module.dyndbg="QUERY" 用于内核内置模块。
	 */
	cmdline = kstrdup(saved_command_line, GFP_KERNEL);
	parse_args("dyndbg params", cmdline, NULL,
		   0, 0, 0, NULL, &ddebug_dyndbg_boot_param_cb);
	kfree(cmdline);
	return 0;

out_err:
	ddebug_remove_all_tables();
	return 0;
}
/* Allow early initialization for boot messages via boot param */
early_initcall(dynamic_debug_init);
前面演示的都是在内核启动完成后对 dyndbg 调试语句的控制,那如果在内核 BOOT 启动阶段,需要控制 dyndbg 语句的启停呢?方式一通过内核命令行参数 ddebug_query="QUERY",dyndbg="QUERY",module.dyndbg="QUERY" 来完成;方式二是在包含的调试接口头文件前定义 DEBUG 宏,这样 dyndbg 调试语句默认就是开启的(详见 4.1 中 dynamic_pr_debug() 展开的 4 种形式)。其中 ddebug_query="QUERY" 已废弃,不建议使用;module.dyndbg="QUERY" 针对编译到内核镜像的内置模块,如 dynamic_debug_example.dyndbg 指定模块是外置模块 dynamic_debug_example.ko,虽然内核启动阶段仍然会对这种情形处理,但不会有任何效果,只有在 modprobe/insmod 时才会真正处理外置模块的 dyndbg 参数,这会后面的章节 4.3 外置模块的 dyndbg 参数 进行分析。
先看下 ddebug_setup_string[] 的设置过程(即解析内核命令行参数 ddebug_query="QUERY"):
/* lib/dynamic_debug.c */

#define DDEBUG_STRING_SIZE 1024
static __initdata char ddebug_setup_string[DDEBUG_STRING_SIZE];

static __init int ddebug_setup_query(char *str)
{
	if (strlen(str) >= DDEBUG_STRING_SIZE) {
		pr_warn("ddebug boot param string too large\n");
		return 0;
	}
	strlcpy(ddebug_setup_string, str, DDEBUG_STRING_SIZE);
	return 1;
}

__setup("ddebug_query=", ddebug_setup_query);
对 ddebug_setup_string[] 的处理(即对内核命令行参数 ddebug_query="QUERY" 处理):
dynamic_debug_init()
	/* 处理 ddebug_query="QUERY" */
	ret = ddebug_exec_queries(ddebug_setup_string, NULL);
对内核命令行参数 dyndbg="QUERY",module.dyndbg="QUERY" 的处理:
dynamic_debug_init()
	cmdline = kstrdup(saved_command_line, GFP_KERNEL);
	parse_args("dyndbg params", cmdline, NULL,
		   0, 0, 0, NULL, &ddebug_dyndbg_boot_param_cb);
		...
		ddebug_dyndbg_boot_param_cb()
			return ddebug_dyndbg_param_cb(param, val, NULL, 0);

/* helper for ddebug_dyndbg_(boot|module)_param_cb */
static int ddebug_dyndbg_param_cb(char *param, char *val,
				const char *modname, int on_err)
{
	char *sep;

	sep = strchr(param, '.'); /* module.dyndbg="QUERY" */
	if (sep) {
		/* needed only for ddebug_dyndbg_boot_param_cb */
		*sep = '\0';
		modname = param;
		param = sep + 1;
	} /*else {*/
		/* dyndbg="QUERY" */
	/*}*/
	if (strcmp(param, "dyndbg"))
		return on_err; /* determined by caller */

	ddebug_exec_queries((val ? val : "+p"), modname);

	return 0; /* query failure shouldnt stop module load */
}
可见,不管是处理 ddebug_query="QUERY",还是处理 module.dyndbg="QUERY"、dyndbg="QUERY",最终都调用 ddebug_exec_queries() 来处理。下面分析 ddebug_exec_queries() 的处理过程:
/* handle multiple queries in query string, continue on error, return
   last error or number of matching callsites.  Module name is either
   in param (for boot arg) or perhaps in query string.
*/
static int ddebug_exec_queries(char *query, const char *modname)
{
	char *split;
	int i, errs = 0, exitcode = 0, rc, nfound = 0;

	for (i = 0; query; query = split) {
		split = strpbrk(query, ";\n");
		if (split)
			*split++ = '\0';

		query = skip_spaces(query);
		if (!query || !*query || *query == '#')
			continue;

		vpr_info("query %d: \"%s\"\n", i, query);

		/* 查询、修改(使能 或 关闭) 对应的 dyndbg 调试语句 */
		rc = ddebug_exec_query(query, modname);
		if (rc < 0) {
			errs++;
			exitcode = rc;
		} else {
			nfound += rc;
		}
		i++;
	}
	...

	if (exitcode)
		return exitcode;
	return nfound;
}

/* 查询、修改(使能 或 关闭) 对应的 dyndbg 调试语句 */
static int ddebug_exec_query(char *query_string, const char *modname)
{
	unsigned int flags = 0, mask = 0;
	struct ddebug_query query;
#define MAXWORDS 9
	int nwords, nfound;
	char *words[MAXWORDS];

	nwords = ddebug_tokenize(query_string, words, MAXWORDS);
	if (nwords <= 0) {
		pr_err("tokenize failed\n");
		return -EINVAL;
	}
	/* check flags 1st (last arg) so query is pairs of spec,val */
	/*
	 * . 解析 flags 操作符: + (增加), - (移除), = (赋值)
	 * . 解析 flags: p, m, f, l, t, _
	 */
	if (ddebug_parse_flags(words[nwords-1], &flags, &mask)) {
		pr_err("flags parse failed\n");
		return -EINVAL;
	}
	/* 查询 dyndbg 调试语句表项 */
	if (ddebug_parse_query(words, nwords-1, &query, modname)) {
		pr_err("query parse failed\n");
		return -EINVAL;
	}
	/* actually go and implement the change */
	nfound = ddebug_change(&query, flags, mask); /* 按请求修改对应的 dyndbg 调试语句表项 */
	vpr_info_dq(&query, nfound ? "applied" : "no-match");

	return nfound;
}

static int ddebug_change(const struct ddebug_query *query,
			unsigned int flags, unsigned int mask)
{
	int i;
	struct ddebug_table *dt;
	unsigned int newflags;
	unsigned int nfound = 0;
	char flagbuf[10];

	/* search for matching ddebugs */
	mutex_lock(&ddebug_lock);
	list_for_each_entry(dt, &ddebug_tables, link) {
		...

		for (i = 0; i < dt->num_ddebugs; i++) {
			struct _ddebug *dp = &dt->ddebugs[i];

			...

			nfound++;

			newflags = (dp->flags & mask) | flags;
			if (newflags == dp->flags)
				continue;
			/*
			 * dyndbg 系列接口
			 * pr_debug() -> dynamic_pr_debug()
			 * dev_dbg() -> dynamic_dev_dbg()
			 * netdev_dbg() -> dynamic_netdev_dbg()
			 * print_hex_dump_bytes(), print_hex_dump_debug() -> dynamic_hex_dump()
			 * 在
			 * (1) HAVE_JUMP_LABEL 情形,使能 或 关闭 static key ,
			 *     通过 static key 状态决定是否输出调试信息;
			 * (2) !HAVE_JUMP_LABEL 情形,仅修改 flags ,通过
			 *     通过 flags 状态决定是否输出调试信息。
			 */
#ifdef HAVE_JUMP_LABEL

			if (dp->flags & _DPRINTK_FLAGS_PRINT) {
				if (!(flags & _DPRINTK_FLAGS_PRINT))
					static_branch_disable(&dp->key.dd_key_true);
			} else if (flags & _DPRINTK_FLAGS_PRINT)
				static_branch_enable(&dp->key.dd_key_true);
#endif
			/* !HAVE_JUMP_LABEL 情形,仅修改 flags,是通过 flags */
			dp->flags = newflags;
			...
		}
	}
	mutex_unlock(&ddebug_lock);

	...

	return nfound;
}
4.2.2 Dynamic debug 的用户空间接口
4.2.2.1 control 文件的建立
static const struct file_operations ddebug_proc_fops = {
	.owner = THIS_MODULE,
	.open = ddebug_proc_open,
	.read = seq_read,
	.llseek = seq_lseek,
	.release = seq_release_private,
	.write = ddebug_proc_write
};

static int __init dynamic_debug_init_debugfs(void)
{
	struct dentry *dir, *file;

	if (!ddebug_init_success)
		return -ENODEV;

	/* 创建 /sys/kernel/debug/dynamic_debug 目录 */
	dir = debugfs_create_dir("dynamic_debug", NULL);
	if (!dir)
		return -ENOMEM;
	/* 创建 /sys/kernel/debug/dynamic_debug/control 文件 */
	file = debugfs_create_file("control", 0644, dir, NULL,
					&ddebug_proc_fops);
	if (!file) {
		debugfs_remove(dir);
		return -ENOMEM;
	}
	return 0;
}

/* Debugfs setup must be done later */
fs_initcall(dynamic_debug_init_debugfs);
4.2.2.2 control 文件的查询(读)
用户空间通过查询(读) control 文件,查看系统中所有 dyndbg 调试语句的状态信息:
# cat /sys/kernel/debug/dynamic_debug/control
[......]
这在前面已经演示过,这里主要看它的内核实现。cat 首先触发 ddebug_proc_open() 调用:
static const struct seq_operations ddebug_proc_seqops = {
	.start = ddebug_proc_start,
	.next = ddebug_proc_next,
	.show = ddebug_proc_show,
	.stop = ddebug_proc_stop
};

static int ddebug_proc_open(struct inode *inode, struct file *file)
{
	vpr_info("called\n");
	return seq_open_private(file, &ddebug_proc_seqops,
				sizeof(struct ddebug_iter));
}
接着调用 ddebug_proc_start() :
ddebug_proc_start()
	dp = ddebug_iter_first(iter); /* 取 @ddebug_tables 表中第1条 dyndbg 调试语句信息 */
然后通过 ddebug_proc_show() 打印第 1 条信息:
static int ddebug_proc_show(struct seq_file *m, void *p)
{
	struct ddebug_iter *iter = m->private;
	struct _ddebug *dp = p;
	char flagsbuf[10];

	vpr_info("called m=%p p=%p\n", m, p);

	if (p == SEQ_START_TOKEN) { /* 第 1 条信息前,加个 标题栏 打印 */
		seq_puts(m,
			 "# filename:lineno [module]function flags format\n");
		return 0;
	}

	/* 打印一条 dyndbg 调试语句信息 struct _ddebug */
	seq_printf(m, "%s:%u [%s]%s =%s \"",
		   trim_prefix(dp->filename), dp->lineno,
		   iter->table->mod_name, dp->function,
		   ddebug_describe_flags(dp, flagsbuf, sizeof(flagsbuf)));
	seq_escape(m, dp->format, "\t\r\n\"");
	seq_puts(m, "\"\n");

	return 0;
}
然后通过 ddebug_proc_next() 取下一条数据,再通过 ddebug_proc_show() 打印:
4.2.2.3 control 文件的修改(写)
用户空间通过修改(写) control 文件,控制 dyndbg 调试的启停:
# echo -n "command ::= match-spec* flags-spec" > /sys/kernel/debug/dynamic_debug/control
同 cat 一样,echo 首先触发 ddebug_proc_open() 调用,这个前面已经进行分析;接下来 echo 会触发 ddebug_proc_write() 调用:
#define USER_BUF_PAGE 4096
static ssize_t ddebug_proc_write(struct file *file, const char __user *ubuf,
				  size_t len, loff_t *offp)
{
	char *tmpbuf;
	int ret;

	if (len == 0)
		return 0;
	if (len > USER_BUF_PAGE - 1) {
		pr_warn("expected <%d bytes into control\n", USER_BUF_PAGE);
		return -E2BIG;
	}
	tmpbuf = memdup_user_nul(ubuf, len);
	if (IS_ERR(tmpbuf))
		return PTR_ERR(tmpbuf);
	vpr_info("read %d bytes from userspace\n", (int)len);

	ret = ddebug_exec_queries(tmpbuf, NULL);
	kfree(tmpbuf);
	if (ret < 0)
		return ret;

	*offp += len;
	return len;
}
可以看到,ddebug_proc_write() 调用 了 ddebug_exec_queries(),这和前面解析内核命令行参数 ddebug_query="QUERY"、dyndbg="QUERY"、module.dyndbg="QUERY" 的逻辑一样,都是查询、修改(启停)匹配的 dyndbg 调试的状态,在次不再赘述。
4.3 外置模块的 dyndbg 参数
4.3.1 外置模块 dyndbg 参数的解析
到此,基本分析了所有 Dynamic debug 功能的相关实现分析,但还缺少对外置模块的 dyndbg 参数的分析。用户空间通过内核接口 sys_finit_module() 加载模块,在加载模块时,解析 dyndbg 参数以控制 dyndbg 调试语句的启停:
/* kernel/module.c */

SYSCALL_DEFINE3(finit_module, int, fd, const char __user *, uargs, int, flags)
{
	...

	return load_module(&info, uargs, flags);
}

static int load_module(struct load_info *info, const char __user *uargs,
		       int flags)
{
	...

	/* Module is ready to execute: parsing args may do that. */
	/* 解析内核模块参数(包括 dyndbg 参数) */
	after_dashes = parse_args(mod->name, mod->args, mod->kp, mod->num_kp,
				  -32768, 32767, mod,
				  unknown_module_param_cb);

	...
}

static int unknown_module_param_cb(char *param, char *val, const char *modname,
				   void *arg)
{
	...

	/* Check for magic 'dyndbg' arg */
	ret = ddebug_dyndbg_module_param_cb(param, val, modname);
	if (ret != 0)
		pr_warn("%s: unknown parameter '%s' ignored\n", modname, param);
	return 0;
}

/* lib/dynamic_debug.c */
int ddebug_dyndbg_module_param_cb(char *param, char *val, const char *module)
{
	vpr_info("module: %s %s=\"%s\"\n", module, param, val);
	return ddebug_dyndbg_param_cb(param, val, module, -ENOENT);
}
看到了吧,这里和内核启动阶段解析 dyndbg 和 module.dyndbg 参数一样,都调用了 ddebug_dyndbg_param_cb(),流程与前面一样,这里就不再赘述。
4.3.2 外置模块 dyndbg 参数的提供方式
外置模块 dyndbg 参数的提供方式包含如下 3 种形式,这 3 种形式如果都配置了,后面的配置会覆盖前面的,也即 4.3.2.1 通过模块配置文件的优先级最低,4.3.2.3 通过模块参数的优先级最高。
4.3.2.1 通过模块配置文件
通过模块配置文件 /etc/modprobe.d/*.conf 进行配置,modprobe 会解析它:
options foo dyndbg=+pt
options foo dyndbg # defaults to +p
4.3.2.2 通过内核命令行参数
foo.dyndbg=" func bar +p; func buz +mp"
前面提到,外置模块 dyndbg 参数虽然在内核启动阶段不生效,但在 modprobe 加载模块时,modprobe 会从内核命令行参数提取,并传给内核接口解析并生效。
4.3.2.3 通过模块参数
modprobe foo dyndbg==pmf # override previous settings
对这最后一种形式,以前面的 dynamic_debug_example.ko 外置模块为例,来示范一下:
root@qemu-ubuntu:~# modprobe dynamic_debug_example dyndbg==pmflt
root@qemu-ubuntu:~# lsmod
Module                  Size  Used by
dynamic_debug_example    16384  0
root@qemu-ubuntu:~# dmesg | tail -n 8
[  126.608822] dyndbg test module init.
[  126.626985] [1005] dynamic_debug_example:dyndbg_task_fn:16: dyndbg test message 0
[  128.688377] [1005] dynamic_debug_example:dyndbg_task_fn:16: dyndbg test message 1
[  130.761998] [1005] dynamic_debug_example:dyndbg_task_fn:16: dyndbg test message 2
[  132.861402] [1005] dynamic_debug_example:dyndbg_task_fn:16: dyndbg test message 3
[  134.937928] [1005] dynamic_debug_example:dyndbg_task_fn:16: dyndbg test message 4
[  137.016631] [1005] dynamic_debug_example:dyndbg_task_fn:16: dyndbg test message 5
root@qemu-ubuntu:~# modprobe -r dynamic_debug_example
root@qemu-ubuntu:~# lsmod
Module                  Size  Used by
root@qemu-ubuntu:~# dmesg | tail -n 8
[  189.167825] [1005] dynamic_debug_example:dyndbg_task_fn:16: dyndbg test message 30
[  191.245793] [1005] dynamic_debug_example:dyndbg_task_fn:16: dyndbg test message 31
[  193.402753] [1005] dynamic_debug_example:dyndbg_task_fn:16: dyndbg test message 32
[  195.477486] [1005] dynamic_debug_example:dyndbg_task_fn:16: dyndbg test message 33
[  197.554432] [1005] dynamic_debug_example:dyndbg_task_fn:16: dyndbg test message 34
[  199.631214] [1005] dynamic_debug_example:dyndbg_task_fn:16: dyndbg test message 35
[  201.708996] [1005] dynamic_debug_example:dyndbg_task_fn:16: dyndbg test message 36
[  203.775266] dyndbg test module exit.
5. Dynamic debug (dyndbg) 的优缺点
Dynamic debug 的优点显而易见,它可以在不重新编译内核的前提下,动态的在运行时启用、关闭调试语句输出,这带来了灵活性;Dynamic debug 的缺点也很明显,由于它使用额外的数据来记录每个 KERN_DEBUG 类型调试语句的状态信息,所以它增大了内核的体积。从前面的 Kconfig 配置,Dynamic debug 功能的作者注释大约增长 2%,经笔者实测,不是很准确,有时候不到 2%。同时插入判定语句多少也会带来一些开销。Linux 内核在默认情形下不会开启 Dynamic debug 。
6. 参考资料
[1] Dynamic debug
[2] 浅析 linux kernel dynamic debug
[3] 动态调试
[4] linux dynamic debug


 3385
3385

 被折叠的 条评论
为什么被折叠?
被折叠的 条评论
为什么被折叠?
 到【灌水乐园】发言


