


 文章深入探讨了Prometheus监控系统,解释了它如何与Micrometer、SpringActuator集成,以及Counter、Gauge、Histogram和Summary等不同类型的指标。文章还讨论了Prometheus的数据处理,包括counter重置和外推法,以及告警规则的编写。此外,还提到了服务发现机制、信号处理中的香农采样定理,以及如何避免向量中出现相同labelset的错误。
背景
Prometheus监控是一概不懂啊,只知道它是个采集监控数据的,PromSQL不会写,弊端不知道,能干什么,不能干什么,这个远远不能满足当前需要。
先从几个疑问开始:
疑问1
- actuator中,暴露的metrics和Prometheus是什么关系?
- MicroMeter是什么,和Prometheus是什么关系?
点式学习
因为自己搭了Prometheus,开启了SpringActuator( endpoint * )进行上报,但是迟迟没收到数据;于是导出搜刮文章,怎么打通体系的:
VMWare: https://tanzu.vmware.com/developer/guides/spring-prometheus/?utm_source=pocket_saves
CalliCoder: https://www.callicoder.com/spring-boot-actuator-metrics-monitoring-dashboard-prometheus-grafana/?utm_source=pocket_saves 这篇文章较好,它说明需要在Prometheus配置为文件那里需要额外配置才能采集到监控数据:增加metric_path
上手示例 https://www.baeldung.com/micrometer
解答1
- metrics和prometheus是同样的数据,以不同的格式展示
- Micrometer和SLF4j是类似的东西,定义门面;比如
PrometheusMeterRegistry就是继承了MicroMeter的MeterRegistryMicrometer provides a simple facade over the instrumentation clients for a number of popular monitoring systems. Currently, it supports the following monitoring systems: Atlas, Datadog, Graphite, Ganglia, Influx, JMX, and Prometheus.
数据类型
参考yunlzheng.gitbook
Counter: 只增不减的计数器
Gauge: 速度表! CPU使用率,线程池活跃线程,任务队列等瞬时值,
Histogram: 反映不同区间样本的个数, 分位数在服务端完成计算
Summary: 分位数在客户端完成计算 查询性能更好
一开始我认为延迟统计可以用来Gauge,其实不行的,因为某一时刻可能会有两个延迟,并且无法进行统计分析;
后边这两个都是用于统计数据的分布情况,比如延迟
示例:
Histogram
prometheus_tsdb_compaction_chunk_range_bucket{le=“100”} 0
prometheus_tsdb_compaction_chunk_range_bucket{le=“400”} 0
Summary
prometheus_tsdb_wal_fsync_duration_seconds{quantile=“0.5”} 0.012352463
prometheus_tsdb_wal_fsync_duration_seconds{quantile=“0.9”} 0.014458005
这两个都有额外的count和sum
快速语法
数学运算:加减乘除 取余 幂运算都有
逻辑运算:and or unless(差集) 也有把 大于小于变成bool的语句
字符串运算:正则 =~ 正则取反 !~ 是 = 不是 !=
语句示例:
http_requests_total{environment=~"staging|testing|development",method!="GET"} [5m] offset 1d
特殊标签__name__来指标的名称
疑问2
- Prometheus Counter求和怎么写,包括处理counter reset场景
- Prometheus报警的书写
- 不通过手动配置,Prometheus怎么发现HTTP服务端点?
- 编写Alert Proemtheus表达式匹配到多个pod时并且>0时,是怎么计算的?
- prometheus是怎么发现新部署的服务的?在k8s集群下又是怎么处理的
- prometheus increase的计算逻辑?
- 是应该先sum后rate还是先rate再sum?
解答3、8-increase、rate有处理counter重置
说来也简单,使用的是外推法。需要注意,外推法(extrapolation)是统计学的概念,相似的还有内插法(interpolation)都是用已有值去推测未知值。外推法有线性外推、多项式外推、锥形外推等,可参见维基百科 我在理解这个increase的外推时,怎么滴就想成了积分,这是求increase,算增量!以v2.43的源码为例https://github.com/prometheus/prometheus/blob/v2.43.0/promql/functions.go#L66 可以简单阅读到,主要计算加了外推时间的间隔extrapolateToInterval 然比sampledInterval 算得比例。其中比较重要的点有二个:一是处理了counter重置的情况(这是个非常重要),如下
resultValue = samples.Points[len(samples.Points)-1].V - samples.Points[0].V
prevValue := samples.Points[0].V
for _, currPoint := range samples.Points[1:] {
    if currPoint.H != nil {
        return nil // Range contains a mix of histograms and floats.
    }
    if !isCounter {
        continue
    }
    if currPoint.V < prevValue {
        resultValue += prevValue
    }
    prevValue = currPoint.V
}
另一个是外推时间的计算,系数1.1乘了平均采样周期
当然github也有一番讨论认为外推是有害的,rate()/increase() extrapolation considered harmful #3746 但是这个讨论目前被锁定了:
It’s appropriate to lock a conversation when the entire conversation is not constructive or violates your community’s code of conduct or GitHub’s Community Guidelines locking-conversations 显然prometheus开发者不接受这个提议
这篇SF回答Do I understand Prometheus’s rate vs increase functions correctly?也值得参考:理想世界中,采样时刻正好在整秒,观察时刻也在整秒
解答9
文档里说了rate和聚合同时需要时,先要rate,https://prometheus.io/docs/prometheus/latest/querying/functions/#rate 因为rate是处理了counter重置情况的(可以看函数extrapolatedRate),而聚合比如sum并不会处理,这会丢失数值,比目标值小。
Note that when combining rate() with an aggregation operator (e.g. sum()) or a function aggregating over time (any function ending in _over_time), always take a rate() first, then aggregate. Otherwise rate() cannot detect counter resets when your target restarts.
我当时写先sum再rate老半天没写出来!
解答3-7
3-学了表达式,就会写了,直接sum counter 重置参见解答8中的源码
4-告警有专门的alert结构
5-这是一个通用的问题,服务发现;如果prometheus不通过配置感知数据源,那么只有数据源主动上报,但是spring actuator是只能被动拉数据,所以总是需要有个配置的 annotation: prometheus.io/scrape
6-那就有一个报一个呗,当时想问什么呢?
7-Prometheus Operator ServiceMonitor CRD Git-Book
渐进
香农采样定理-奈奎斯特采样定律
监控数据的分析,和信号处理是类似的。最近我看到我们的Kafka消费Lag居然出现了锯齿状图形,先是慢慢增加,然后突然将为零;这个根本讲不通,一个pod的消费能力不可能变化这么大;搜索一番,一个StackOverflow回答(How does a sawtooth pattern of Kafka consumer lag emerge?)是值得记录的:一种可能是观测的窗口range大小比数据收集频率大,换做信号处理就是说违背了香农采样定理: 为了不失真地恢复模拟信号,采样频率应该大于等于模拟信号频谱中最高频率的2倍。 当采样频率过小时,就会出现混叠(aliasing), 或者莫阿效应(就是手机拍屏幕出现条纹)啊,伟大信息科学技术! 就是说可能是采样频率过低导致输出图形失真。但是呢,我又想了下,因为堆积量变化不可能短时间有那么大,所以应该是消息过期了。
vector cannot contain metrics with the same labelset
向量不能含有labelset一样的metrics,为什么会存在labelset一样的metrics?
向量,指的是一组相关的时序
Since Prometheus is a timeseries database, all data is in the context of some timestamp. The series that maps a timestamp to recorded data is called a timeseriesa set of related timeseries is called a vector
Prometheus中,当数据被转换后,名字就被丢弃,因为你不知道它是否还代表原来的意思, issues-380
是因为vector中,当__name__被移除后,存在相同的labelset就需要用label_replace从__name__中截取字段生成一个新label rate时
how-to-avoid-vector-cannot-contain-metrics-with-the-same-labelset-error-when-p
rate(label_replace({__name__=~"camel_proxy.*count"},"name_label","$1","__name__", "(.+)")[5m:])
$1指的是最后面正则表达式的域匹配
标签替换函数
label_replace(v instant-vector, dst_label string, replacement string, src_label string, regex string)
v: 原始选择器
dst_label: 新的label
replacement: 新label的值,可以用$引用匹配到的值
src_lable: 源label,比如__name__
regex: 在源label选择匹配内容的正则表达式- 注意
[5m:]
VictoriaMetrics中则不会有这个问题,他们避免了这个问题
在prometheus早些年,使用者抱怨因为数据转换,原始的__name__会引起混淆,所以应该移除metric name,过了些年,用户又抱怨因为没了__name__导致报错
简书-云原生监控Prometheus对样本rate计算,出现标签重复?
StackOverflow-Prometheus instant vector vs range vector
Instant vector - a set of timeseries where every timestamp maps to a single data point at that “instant”
Range vector - a set of timeseries where every timestamp maps to a “range” of data points, recorded some duration into the past.
Prometheus step的选择
特别注意,有rate/irate函数时,rate的窗口要和step保持一致,并且step应该稍大于prometheus的采集周期(如15s),这里不应该和采样定理混在一起,比如设置step是7s,即用更高的频率,只会徒增Prometheus计算成本,因为计算rate至少要两个采样点,rate并不是看原始信号的形态。
新的疑问-追加的_count _total
- 有的metrics会在你定义的名字上加
_total有的会加_count有的会加_sum这是为什么,它和metric类型有什么关系,我搜了一圈没有找到答案。
答:这篇文章说明了: https://www.timescale.com/blog/four-types-prometheus-metrics-to-collect/
| metric | 解析 | 增加的后缀 | 常用函数 |
|---|---|---|---|
| counter | Counter metrics are used for measurements that only increase. | _total | increase rate |
| guauge | avg_over_time max_over_time min_over_time quantile_overtime | ||
| histogram | Histograms divide the entire range of measurements into a set of intervals—named buckets—and count how many measurements fall into each bucket. | _count _sum [_bucket with le label] | histogram_quantile |
| summary | Like histograms, summary metrics are useful to measure request duration and response sizes. | _count _sum [raw name with quantile label] |
实际上Histogram 是由3个指标构成的:
- 所有采样点的个数 _total后缀
- 采样到的数据之和 _sum后缀
- 小于等于N的采样点数据的个数,_bucket后缀,通常还有个
le标签来表示N
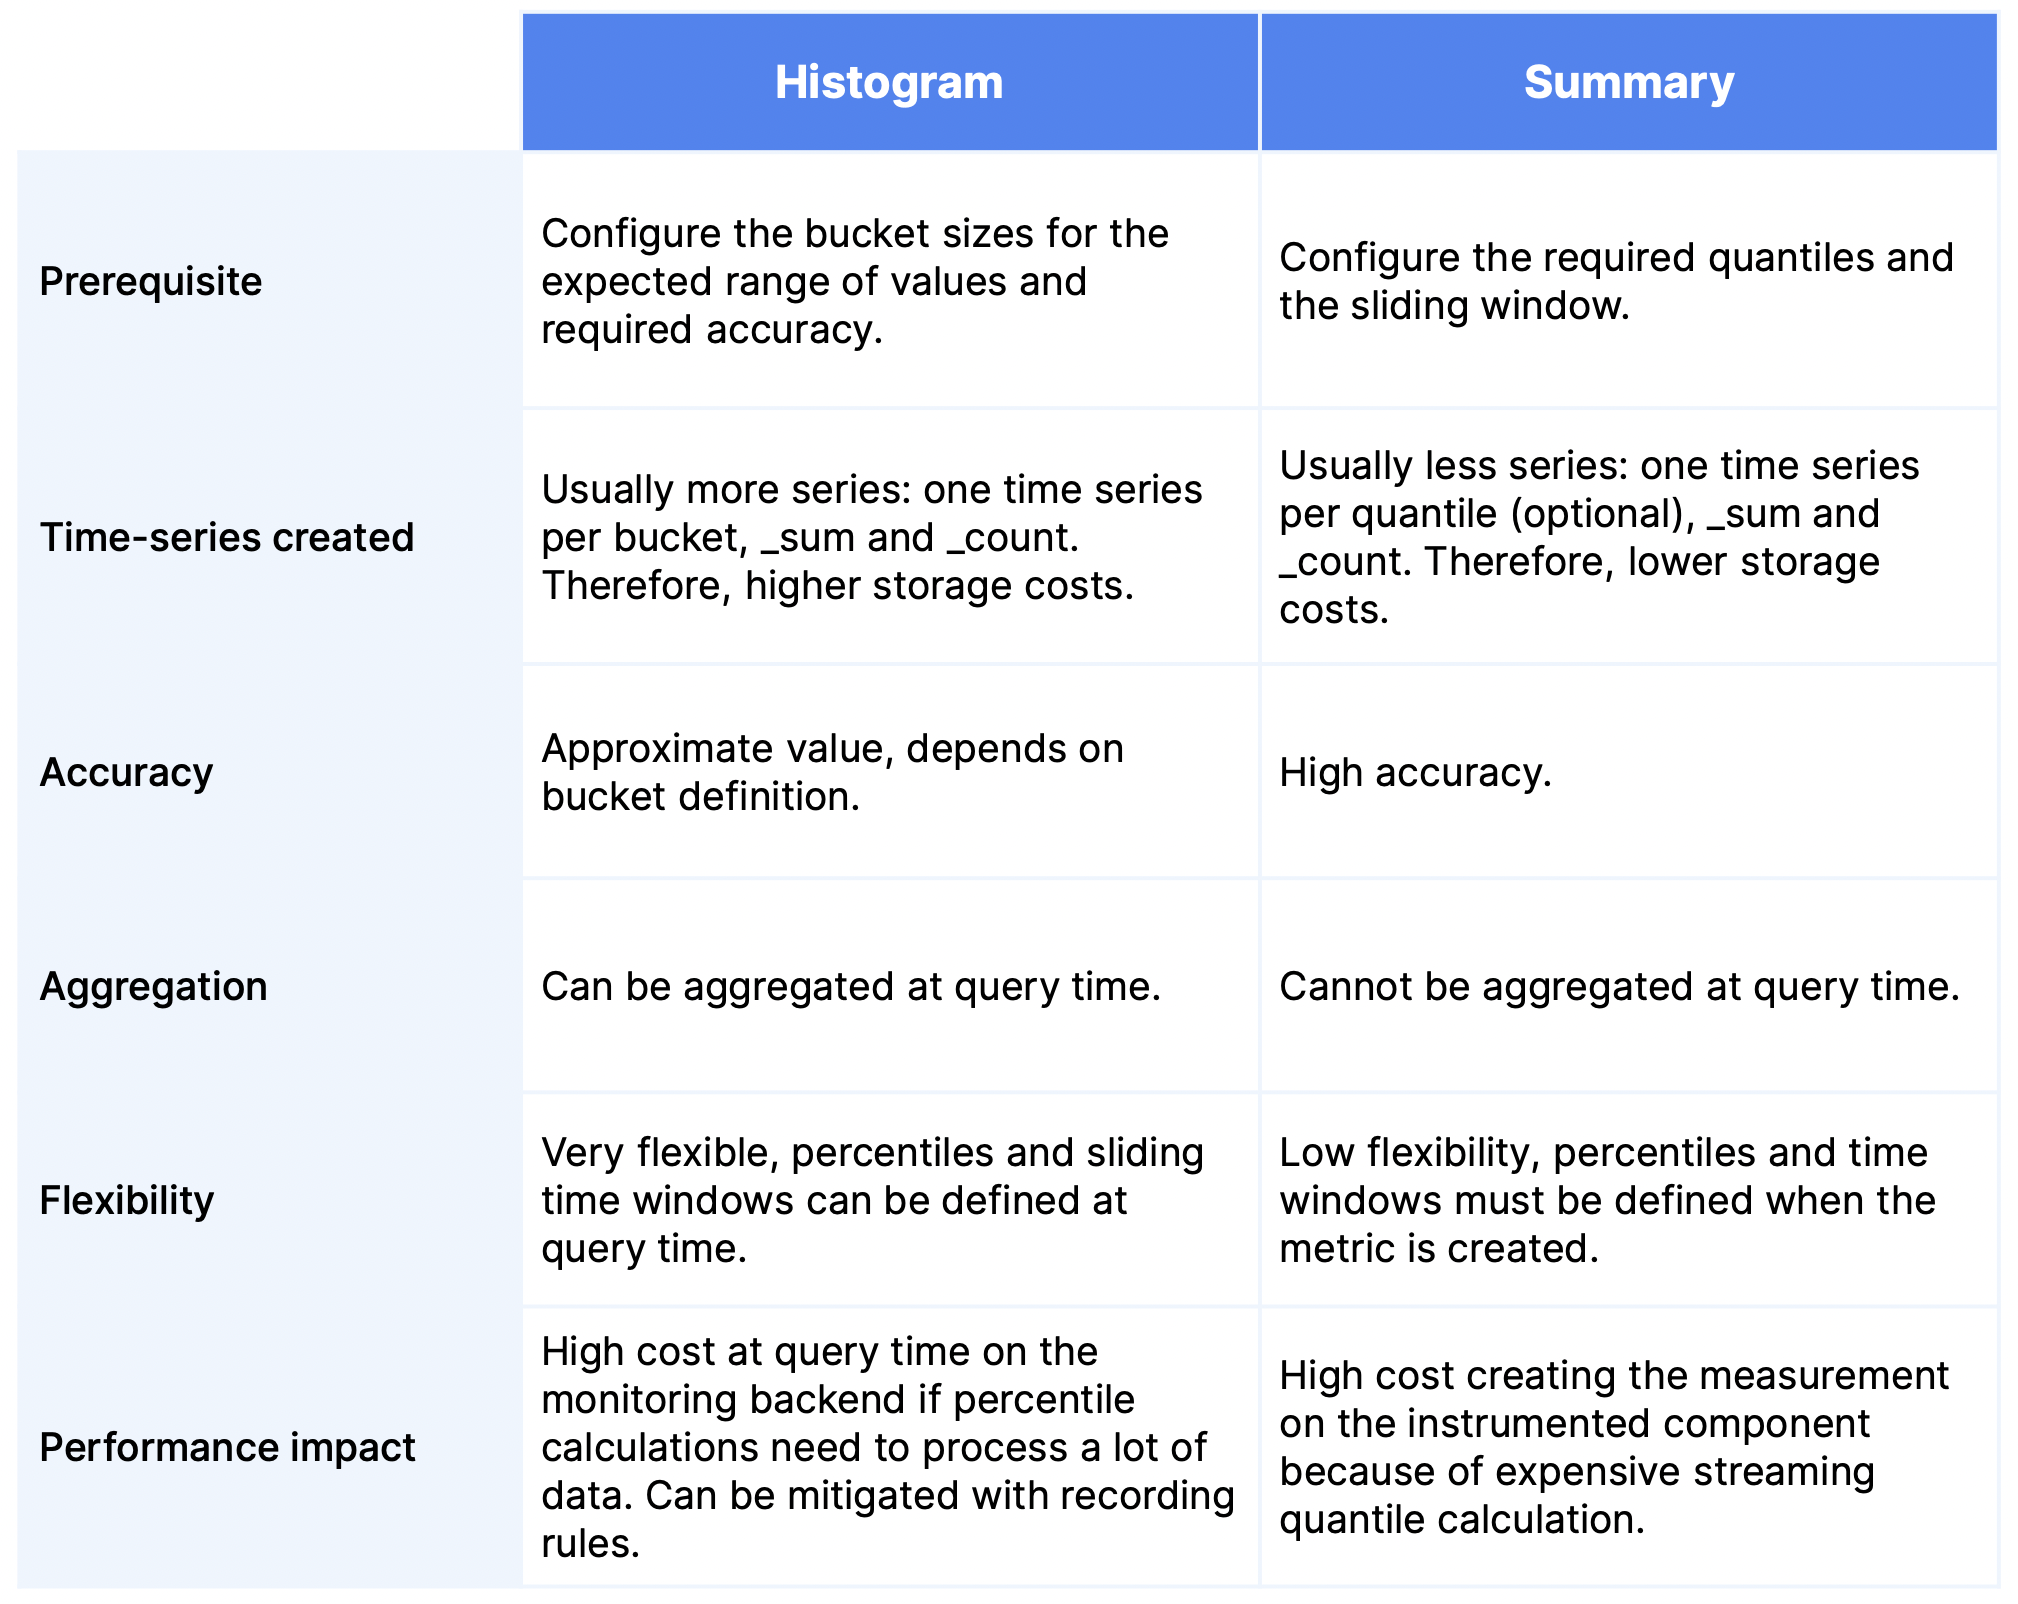
Histogram有3个缺陷
- bucket需要预定义 需要 upfront design
- 不是精确值的百分比,但是其实bucket是你自己定义的 reasonable accuracy.
- service端计算,量的的话对服务压力大,可以使用 recording rules解决
实际上Summary也 是由3个指标构成的:
- 所有采样点个数 _count后缀
- 所有采样数据之和 _sum后缀
- 可选的:一个通过guage暴露的分位数(quantile),名字就是你定义的名字,会有个quantile标签,client 通过可配置的滑动窗口内的计算的分位数(并不是整个pod存活期间),可以得到90分位 95分位 99分位值等
Summary也有三个缺陷
- 客户端计算分为数也是昂贵的(server端昂贵,client端也昂贵,没便宜的了是吧?)要维持时间窗口内的有序采样数据列表,另外,并不是所有客户端支持分位数计算(2022.4.14)
- 分位数要预定义
- 多个Summary无法聚合 it’s impossible to aggregate summaries across multiple series (就是说,只能看到一个pod的此summary指标,无法聚合这个应用的指标);同样也无法看到所有指标的99分位
Histogram和Summary怎么选?
大多时候可以选histograms,因为它可以聚合
https://www.timescale.com/blog/content/images/2022/04/histogram-summary-prometheus-timescale.png
- actuator http_server_requests_seconds_max 的类型
指标的类型写在指标的后面
curl win:8080/actuator/prometheus | grep http_server_requests_seconds#TYPE http_server_requests_seconds summary
http_server_requests_seconds_count{error=“none”,exception=“none”,method=“GET”,outcome=“SUCCESS”,status=“200”,uri=“/actuator/prometheus”,} 5.0
http_server_requests_seconds_sum{error=“none”,exception=“none”,method=“GET”,outcome=“SUCCESS”,status=“200”,uri=“/actuator/prometheus”,} 1.2738842
http_server_requests_seconds_count{error=“none”,exception=“none”,method=“GET”,outcome=“CLIENT_ERROR”,status=“405”,uri=“UNKNOWN”,} 2.0
http_server_requests_seconds_sum{error=“none”,exception=“none”,method=“GET”,outcome=“CLIENT_ERROR”,status=“405”,uri=“UNKNOWN”,} 0.0146485
http_server_requests_seconds_count{error=“none”,exception=“none”,method=“POST”,outcome=“SUCCESS”,status=“200”,uri=“/”,} 1.0
http_server_requests_seconds_sum{error=“none”,exception=“none”,method=“POST”,outcome=“SUCCESS”,status=“200”,uri=“/”,} 0.0034377
#HELP http_server_requests_seconds_max
#TYPE http_server_requests_seconds_max gauge
http_server_requests_seconds_max{error=“none”,exception=“none”,method=“GET”,outcome=“SUCCESS”,status=“200”,uri=“/actuator/prometheus”,} 1.0139894
http_server_requests_seconds_max{error=“none”,exception=“none”,method=“GET”,outcome=“CLIENT_ERROR”,status=“405”,uri=“UNKNOWN”,} 0.0
http_server_requests_seconds_max{error=“none”,exception=“none”,method=“POST”,outcome=“SUCCESS”,status=“200”,uri=“/”,} 0.0


 被折叠的 条评论
为什么被折叠?
被折叠的 条评论
为什么被折叠?
 到【灌水乐园】发言


