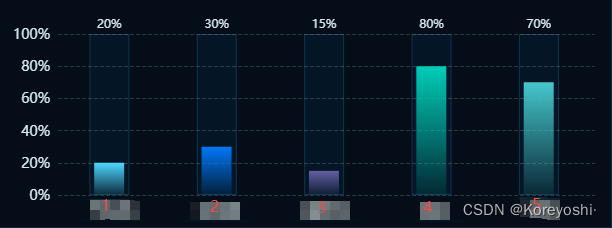
#### 记录自己写过的echarts图表(柱状图边框)
// 渐变柱状图的颜色
const offsetColor0 = ['rgba(79,216,255, 1)', 'rgba(0,120,248, 1)', 'rgba(100,95,164, 1)', 'rgba(0,206,184, 1)', 'rgba(69,199,204, 1)']
const offsetColor1 = ['rgba(79,216,255, 0.1)', 'rgba(0,120,248, .1)', 'rgba(100,95,164, .1)', 'rgba(0,206,184, .1)', 'rgba(69,199,204, .1)']
const series1 = {
  name: '',
  type: 'bar',
  barWidth: 30,
  label: {
    show: false
  },
  itemStyle: {
    normal: {
      color: (params) => {
        return new echarts.graphic.LinearGradient(0, 0, 0, 1, [
          {
            offset: 0,
            color: offsetColor0[params.dataIndex]
          },
          {
            offset: 1,
            color: offsetColor1[params.dataIndex]
          }
        ])
      }
    }
  },
  data: this.value[0]
}
const yFormatterUnit = '%' // Y轴单位
const series2 = {
  name: '',
  type: 'bar',
  barWidth: 40,
  barGap: '-116%',
  z: -1,
  label: {
    show: true,
    position: 'top',
    color: '#D7E9EE',
    formatter: (params) => {
      const data = this.value[0][params.dataIndex] || this.value[0][params.dataIndex] === 0 ? this.value[0][params.dataIndex] + yFormatterUnit : ''
      return data
    }
  },
  itemStyle: {
    color: 'rgba(5,43,66,0.3)',
    borderColor: 'rgba(36,147,199,0.3)',
    borderWidth: 1
  },
  data: this.value[1]
}


 3565
3565


 被折叠的 条评论
为什么被折叠?
被折叠的 条评论
为什么被折叠?
 到【灌水乐园】发言


