父组件:
<lineChartIncome :opt="tradeIncome" />
import lineChartIncome from "./components/lineChartIncome";
data() {
return {
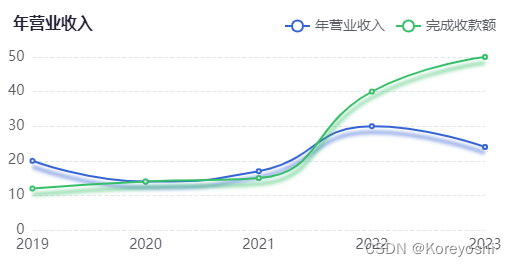
tradeIncome: {
seriesData: [[20, 14, 17,30,24], [12, 14, 15,40,50]],
xData: ['2019', '2020', '2021', '2022', '2023'],
legend: ['年营业收入', '完成收款额']
}
}
}
子组件:
<template>
<div style="width: 100%;height: 100%;">
<ChartPanel ref="chart" :option="options" :style="opt.yAxisName ? 'height:calc(100% - 16px)' : ''"></ChartPanel>
</div>
</template>
<script>
import * as echarts from 'echarts'
import ChartPanel from '@/components/ChartPanel';
export default {
components: {
ChartPanel
},
props: {
opt: {
type: Object,
default() {
return {}
}
}
},
data() {
return {
options: null
}
},
watch: {
opt: {
deep: true,
immediate: true,
handler(val) {
this.getOpt(val)
}
}
},
methods: {
getOpt(val) {
let {
seriesData,
xData,
legend
} = val
this.options = {
title: {
text: '年营业收入',
x: 'left',
y: 0,
textStyle: {
color: 'rgba(35, 35, 56, 1)',
fontSize: 16,
fontWeight: '700',
},
},
legend: {
data: legend,
align: 'left',
right: '0',
top: 2,
textStyle: {
color: "#595D64",
fontSize: 14
}
},
grid: {
left: '0',
right: '16',
top: 45,
bottom: '0',
containLabel: true
},
tooltip: {
trigger: 'axis',
formatter: params => {
let result = `<div style="font-weight:700">${params[0].name}年</div>`
params.forEach(ele => {
result += `<div>${ele.seriesName}
<span style="color:${ele.color};font-weight:700">${ele.value}万元</span>
</div>`
});
return result
}
},
xAxis: [{
type: 'category',
data: xData,
splitArea: {
color: '#f00',
lineStyle: {
color: '#f00'
},
},
axisLabel: {
textStyle: {
color: "#595D64",
fontSize: 14,
}
},
axisTick: {
show: false,
},
axisLine: {
lineStyle: {
color: '#E1E5ED',
type: 'dashed'
}
},
boundaryGap: false,
}],
yAxis: [{
type: 'value',
axisLabel: {
formatter: value => {
return value + ''
},
show: true,
textStyle: {
color: "#595D64",
fontSize: 14,
},
},
splitLine: {
lineStyle: {
color: '#E1E5ED',
type: 'dashed'
}
}
}],
series: [{
name: legend[0],
type: 'line',
data: seriesData[0],
smooth: true,
lineStyle: {
width: 2,
color: '#3562D4',
shadowColor: '#3562D4',
shadowBlur: 4,
shadowOffsetY: 6
},
itemStyle: {
normal: {
color: '#3562D4',
borderColor: '#3562D4'
}
},
}, {
name: legend[1],
type: 'line',
data: seriesData[1],
smooth: true,
lineStyle: {
width: 2,
color: '#34BF66',
shadowColor: '#34BF66',
shadowBlur: 4,
shadowOffsetY: 6
},
itemStyle: {
normal: {
color: '#34BF66',
borderColor: '#34BF66'
}
}
},
]
};
this.$nextTick(() => {
this.$refs.chart.initChart(echarts, chart => {
this.options && chart.setOption(this.options, true);
});
})
}
}
}
</script>


 4131
4131


 被折叠的 条评论
为什么被折叠?
被折叠的 条评论
为什么被折叠?
 到【灌水乐园】发言


