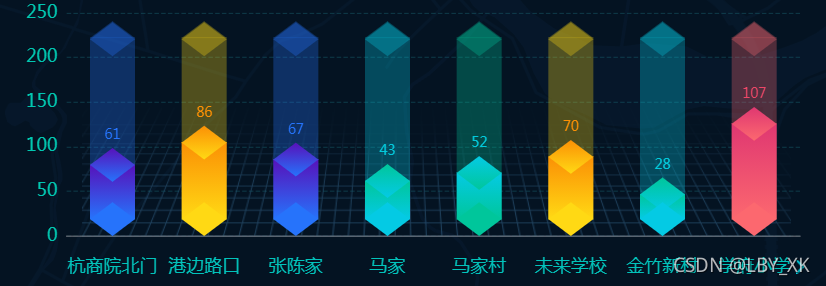
效果图

代码
var buyTop = echarts.init(document.getElementById('fluxorder'));
var color1 = new echarts.graphic.LinearGradient(0, 1, 0, 0, [{ offset: 0, color: "#2673fb" }, { offset: 1, color: "#5711ba" }], false);
var color2 = new echarts.graphic.LinearGradient(0, 1, 0, 0, [{ offset: 0, color: "#ffd914" }, { offset: 1, color: "#fb9005" }], false);
var color3 = new echarts.graphic.LinearGradient(0, 1, 0, 0, [{ offset: 0, color: "#2673fb" }, { offset: 1, color: "#5711ba" }], false);
var color4 = new echarts.graphic.LinearGradient(0, 1, 0, 0, [{ offset: 0, color: "#04cae4" }, { offset: 1, color: "#00c69b" }], false);
var color5 = new echarts.graphic.LinearGradient(0, 1, 0, 0, [{ offset: 0, color: "#00c69b" }, { offset: 1, color: "#04cae4" }], false);
var color6 = new echarts.graphic.LinearGradient(0, 1, 0, 0, [{ offset: 0, color: "#ffd914" }, { offset: 1, color: "#fb9005" }], false);
var color7 = new echarts.graphic.LinearGradient(0, 1, 0, 0, [{ offset: 0, color: "#04cae4" }, { offset: 1, color: "#00c69b" }], false);
var color8 = new echarts.graphic.LinearGradient(0, 1, 0, 0, [{ offset: 0, color: "#fc686f" }, { offset: 1, color: "#df3771" }], false);
var option = {
color: [color1, color2, color3, color4, color5, color6, color7, color8],
color2: ["#2673fb", "#ffd914", "#2673fb", "#04cae4", "#00c69b", "#ffd914", "#04cae4", "#fc686f"],
tooltip: { axisPointer: { type: 'shadow' } },
xAxis: { type: 'category', axisLabel: { show: false,margin: 20 }, data: [] ,offset: 20,
axisTick: {
show: false,
},
axisLabel: {
interval: 0,
margin: 0,
textStyle: {
color: '#02c3bb',
fontStyle: 'normal',
fontSize: 16,
}
}},
yAxis: { type: 'value', axisLabel: { show: false,margin: 20 },splitLine: {
show: true,
lineStyle: {
type: 'dashed',
color: '#155866',
opacity: '0.5'
}
},
axisTick: {
show: false
},
axisLabel: {
fontSize: 16,
textStyle: {
color: '#01c7b0'
},
},
boundaryGap: false },
grid: {
left: '10%',
right: '4%',
bottom: '13%',
top: '11%',
padding: '0 0 0 0',
containLabel: true,
},
graphic: [
{
type: 'image',
style:{
image:'../img/bgimg/wgbg.png',
x:130,
y:30,
width:630,
height:200
}
}
],
series: [
{
name: '标签',
type: 'pictorialBar',
symbol: 'rect',
symbolSize: ['40', '100%'],
data: [],
z: 2,
symbolOffset: ['0', '-15'],
},
{
name: 'b',
stack: 'amount',
tooltip: { show: false },
type: 'pictorialBar',
symbol: 'diamond',
symbolSize: ['40', '30'],
symbolOffset: ['0', '-29.8'],
symbolPosition: 'end',
data: [],
z: 3,
},
{
name: 'c',
stack: 'amount',
tooltip: { show: false },
type: 'pictorialBar',
symbol: 'diamond',
symbolSize: ['40', '30'],
symbolPosition: 'start',
data: [],
z: 3
},
{
name: 'd',
tooltip: { show: false },
type: 'pictorialBar',
symbol: 'rect',
symbolSize: ['40', '100%'],
data: [],
z: 0,
symbolOffset: ['0', '-15']
},
{
name: 'e',
stack: 'amount',
tooltip: { show: false },
type: 'pictorialBar',
symbol: 'diamond',
symbolSize: ['40', '30'],
symbolOffset: ['0', '-28.4'],
symbolPosition: 'end',
data: [],
z: 0
},
{
name: 'f',
stack: 'amount',
tooltip: { show: false },
type: 'pictorialBar',
symbol: 'triangle',
symbolSize: ['40', '15'],
symbolOffset: ['0', '-32.3'],
symbolPosition: 'end',
data: [],
z: 0
},
]
};
option.series[0].name = "数量";
var data = [
{color:"#2674fc", name: "杭商院北门", value: 61, maxvalue: 200 },
{color:"#fb9005", name: "港边路口", value: 86, maxvalue: 200 },
{color:"#2674fc", name: "张陈家", value: 67, maxvalue: 200 },
{color:"#03c9db", name: "马家", value: 43, maxvalue: 200 },
{color:"#03c9db", name: "马家村", value: 52, maxvalue: 200 },
{color:"#fb9005", name: "未来学校", value: 70, maxvalue: 200 },
{color:"#03c9db", name: "金竹新村", value: 28, maxvalue: 200 },
{color:"#ec4767", name: "学府小学", value: 107, maxvalue: 200 }
];
for (var i = 0; i < data.length; i++) {
option.xAxis.data.push(data[i].name);
option.series[0].data.push({
value: data[i].value,
itemStyle: { color: option.color[i % (option.color.length)] },
animation: false
});
option.series[1].data.push({
value: data[i].value,
itemStyle: { color: option.color[i % (option.color.length)] },
label: {
show: true,
position: 'top',
textStyle: {
fontSize: 12,
color:data[i].color
},
},
animation: false
});
option.series[2].data.push({
value: 4.5,
itemStyle: { color: option.color2[i % (option.color2.length)] },
animation: false
});
option.series[3].data.push({
value: data[i].maxvalue+3.5,
itemStyle: { color: option.color2[i % (option.color.length)], opacity: 0.3 },
emphasis: { itemStyle: { color: option.color2[i % (option.color.length)] } },
animation: false
});
option.series[4].data.push({
value: data[i].maxvalue+3.5,
itemStyle: { color: option.color2[i % (option.color.length)], opacity: 0.3, },
emphasis: { itemStyle: { color: option.color2[i % (option.color.length)] } },
animation: false
});
option.series[5].data.push({
value: data[i].maxvalue,
itemStyle: { color: option.color2[i % (option.color.length)], opacity: 0.3, },
emphasis: { itemStyle: { color: option.color2[i % (option.color.length)] } },
animation: false
});
}
buyTop.setOption(option);
var updown = document.getElementById('updown');
var updowndata = [["马家村", "马家", "张陈家", "港边路口", "杭商院北门"], [10, 13, 15, 18, 23],]
function updownNum(dom, data) {
var updown = echarts.init(dom)
var undownoption = {
grid: {
left: '10%',
right: '4%',
bottom: '10%',
top: '8%',
padding: '0 0 0 0',
containLabel: true,
},
tooltip: {},
xAxis: {
axisLabel: {
show: false
},
splitLine: {
show: false
}
},
yAxis: {
type: "category",
data: data[0],
axisLine: {
show: false
},
axisTick: {
show: false
},
axisLabel: {
textStyle: {
color: '#00c0d3',
fontStyle: 'normal',
fontSize: 16,
}
}
},
series: [
{
name: '人数',
type: 'pictorialBar',
z: -1,
barWidth: 15,
data: data[1],
symbol: 'image://../img/bgimg/zhuzhuangtu.png',
symbolOffset: [0, '60%'],
itemStyle: {
normal: {
color: new echarts.graphic.LinearGradient(
0, 0, 1, 0,
[
{ offset: 0, color: '#112e4f' },
{ offset: 1, color: '#0380e1' }
]
),
label: {
position: 'right',
textStyle: {
color: '#00c0d3',
fontSize: 16
}
},
},
}
},
{
name: '人数',
type: 'pictorialBar',
data: data[1],
barWidth: 35,
z: 1,
symbol: 'react',
symbolRepeat: 'fixed',
symbolSize: ['6%', '100%'],
symbolMargin: 1,
itemStyle: {
normal: {
color: new echarts.graphic.LinearGradient(
0, 0, 1, 0,
[
{
offset: 0,
color: 'rgba(0, 122, 204, 0.2)'
},
]
),
label: {
show: true,
position: 'insideRight',
textStyle: {
color: '#00ffff',
fontStyle: 'italic',
fontSize: 16
}
},
},
}
},
]
};
updown.setOption(undownoption);
}
updownNum(updown, updowndata)


 2035
2035

 被折叠的 条评论
为什么被折叠?


