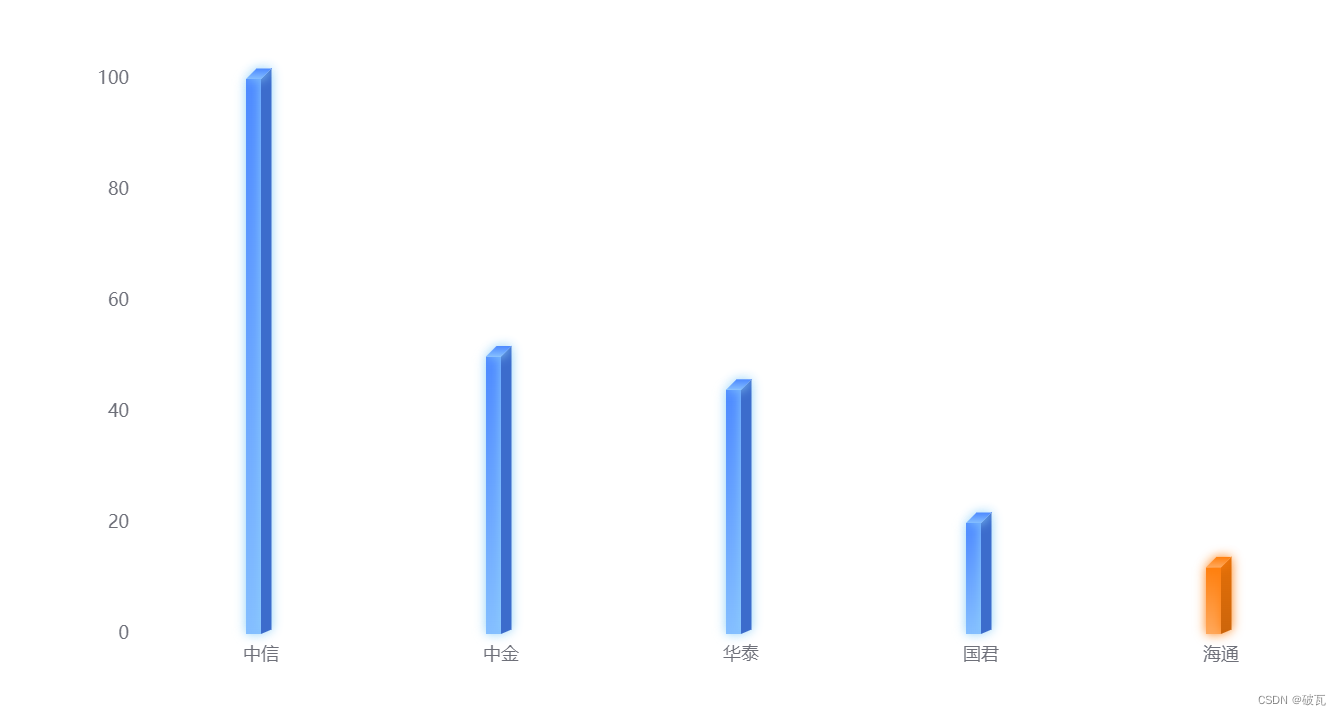
Echarts-实现3D柱状图显示,并单个柱子变色

效果如下:

在这里插入图片描述

<!DOCTYPE html>
<html>
  <head>
    <meta charset="utf-8" />
    <title>模拟3D柱状图+渐变色柱子</title>

    <script
      type="text/javascript"
      src="https://cdn.jsdelivr.net/npm/echarts@5/dist/echarts.min.js"
    ></script>
    <script src="https://apps.bdimg.com/libs/jquery/2.1.4/jquery.min.js"></script>
  </head>
  <body>
    <div id="bar" style="width: 1000px; height: 500px"></div>
    <script type="text/javascript">
      let myBarChart = echarts.init(document.getElementById('bar'))
      // 得到的数据
      let seriesData1 = [
        {
          name: '国君',
          value: 20,
        },
        {
          name: '中信',
          value: 100,
        },
        {
          name: '中金',
          value: 50,
        },
        {
          name: '华泰',
          value: 44,
        },
        {
          name: '海通',
          value: 12,
        },
      ]
      // 柱子降序排列
      seriesData1.sort((a, b) => b.value - a.value)
      console.log(seriesData1)

      // x轴证券公司名称
      let xData = []
      seriesData1.forEach((item) => {
        xData.push(item.name)
      })
      // 数据
      let seriesData = []
      seriesData1.forEach((item) => {
        seriesData.push(item.value)
      })

      // 颜色组
      let linearArr = [
        '#4D89FF',
        '#84BEFF',
        '#3C6CCC',
        '#FFA95D',
        '#FF7F0E',
        '#CC650B',
        '#E46F07',
      ]

      // 绘制左侧面
      const offsetX = 10,
        sliderWidth = 7,
        offsetTick = 10
      const CubeLeft = echarts.graphic.extendShape({
        shape: {
          x: 0,
          y: 0,
        },
        buildPath: function (ctx, shape) {
          // shape是从custom传入的
          const api = shape.api
          const xAxisPoint = api.coord([shape.xValue, 0])
          const c0 = [shape.x - offsetTick, shape.y]
          const c1 = [shape.x - offsetTick + offsetX, shape.y]
          const c2 = [xAxisPoint[0] - offsetTick + offsetX, xAxisPoint[1]]
          const c3 = [xAxisPoint[0] - offsetTick, xAxisPoint[1]]
          ctx
            .moveTo(c0[0], c0[1])
            .lineTo(c1[0], c1[1])
            .lineTo(c2[0], c2[1])
            .lineTo(c3[0], c3[1])
            .closePath()
        },
      })
      // 绘制右侧面
      const CubeRight = echarts.graphic.extendShape({
        shape: {
          x: 0,
          y: 0,
        },
        buildPath: function (ctx, shape) {
          const api = shape.api
          const xAxisPoint = api.coord([shape.xValue, 0])
          const c1 = [shape.x - offsetTick + offsetX, shape.y]
          const c2 = [
            shape.x - offsetTick + offsetX + sliderWidth,
            shape.y - sliderWidth,
          ]
          const c3 = [
            xAxisPoint[0] - offsetTick + offsetX + sliderWidth,
            xAxisPoint[1] - sliderWidth + 4,
          ]
          const c4 = [shape.x - offsetTick + offsetX, xAxisPoint[1]]
          ctx
            .moveTo(c1[0], c1[1])
            .lineTo(c2[0], c2[1])
            .lineTo(c3[0], c3[1])
            .lineTo(c4[0], c4[1])
            .closePath()
        },
      })
      // 绘制顶面
      const CubeTop = echarts.graphic.extendShape({
        shape: {
          x: 0,
          y: 0,
        },
        buildPath: function (ctx, shape) {
          const c1 = [shape.x - offsetTick, shape.y]
          const c2 = [shape.x - offsetTick + offsetX, shape.y] // 右点
          const c3 = [
            shape.x - offsetTick + offsetX + sliderWidth,
            shape.y - sliderWidth,
          ]
          const c4 = [shape.x - offsetTick + sliderWidth, shape.y - sliderWidth]
          ctx
            .moveTo(c1[0], c1[1])
            .lineTo(c2[0], c2[1])
            .lineTo(c3[0], c3[1])
            .lineTo(c4[0], c4[1])
            .lineTo(c1[0], c1[1])
            .closePath()
        },
      })

      // 注册三个面图形
      echarts.graphic.registerShape('CubeLeft', CubeLeft)
      echarts.graphic.registerShape('CubeRight', CubeRight)
      echarts.graphic.registerShape('CubeTop', CubeTop)

      option = {
        xAxis: {
          axisTick: {
            // 不显示坐标刻度
            show: false,
          },
          axisLine: {
            show: false, // 不显示坐标轴线
          },
          data: xData,
        },
        yAxis: {
          type: 'value',

          // 不显示网格
          splitLine: {
            show: false,
          },
        },
        series: [
          {
            type: 'custom',
            data: seriesData,
            itemStyle: {
              shadowColor: '#000',
              shadowBlur: 100,
            },
            renderItem: function (params, api) {
              let location = api.coord([api.value(0), api.value(1)])
              console.log(seriesData[params.dataIndex])
              return {
                type: 'group',

                children: [
                  // 柱子前面
                  {
                    type: 'CubeLeft',
                    // shape 属性描述了这个矩形的像素位置和大小
                    shape: {
                      api,
                      xValue: api.value(0), //表示取出当前 dataItem 中第一个维度的数值
                      yValue: api.value(0),
                      x: location[0],
                      y: location[1],
                    },
                    style: {
                      //柱子阴影
                      shadowColor:
                        xData[params.dataIndex] === '海通'
                          ? '#FF7F0E'
                          : '#8DD0FA',
                      shadowOffsetX: 0,
                      shadowOffsetY: 0,
                      shadowBlur: 7,
                      // 颜色
                      fill: new echarts.graphic.LinearGradient(0, 0, 0, 1, [
                        {
                          offset: 0,

                          color:
                            xData[params.dataIndex] === '海通'
                              ? linearArr[4]
                              : linearArr[0],
                        },
                        {
                          offset: 1,
                          color:
                            xData[params.dataIndex] === '海通'
                              ? linearArr[3]
                              : linearArr[1],
                        },
                      ]),
                    },
                  },
                  // 柱子侧面
                  {
                    type: 'CubeRight',
                    shape: {
                      api,
                      xValue: api.value(0),
                      yValue: api.value(1),
                      x: location[0],
                      y: location[1],
                    },
                    style: {
                      //柱子阴影
                      shadowColor:
                        xData[params.dataIndex] === '海通'
                          ? '#FF7F0E'
                          : '#8DD0FA',
                      shadowOffsetX: 0,
                      shadowOffsetY: 0,
                      shadowBlur: 7,
                      //颜色
                      fill: new echarts.graphic.LinearGradient(0, 0, 0, 1, [
                        {
                          offset: 0,
                          color:
                            xData[params.dataIndex] === '海通'
                              ? linearArr[6]
                              : linearArr[2],
                        },
                        {
                          offset: 1,
                          color:
                            xData[params.dataIndex] === '海通'
                              ? linearArr[5]
                              : linearArr[2],
                        },
                      ]), //平面颜色
                    },
                  },
                  // 柱子顶部
                  {
                    type: 'CubeTop',
                    shape: {
                      api,
                      xValue: api.value(0),
                      yValue: api.value(1),
                      x: location[0],
                      y: location[1],
                    },
                    style: {
                      //柱子阴影
                      shadowColor:
                        xData[params.dataIndex] === '海通'
                          ? '#FF7F0E'
                          : '#8DD0FA',
                      shadowOffsetX: 0,
                      shadowOffsetY: 0,
                      shadowBlur: 7,
                      fill: new echarts.graphic.LinearGradient(0, 0, 0, 1, [
                        {
                          offset: 0,
                          color:
                            xData[params.dataIndex] === '海通'
                              ? linearArr[4]
                              : linearArr[0],
                        },
                        {
                          offset: 1,
                          color:
                            xData[params.dataIndex] === '海通'
                              ? linearArr[3]
                              : linearArr[1],
                        },
                      ]), //平面颜色
                    },
                  },
                ],
              }
            },
          },
        ],
      }
      myBarChart.setOption(option)
    </script>
  </body>
</html>

  • 3
    点赞
  • 3
    收藏
    觉得还不错? 一键收藏
  • 打赏
    打赏
  • 0
    评论
A:要在vue中实现3D柱状图,可以使用echarts-liquidfill插件。这个插件是一个基于Three.js封装的echarts插件,并且可以支持3D柱状图、水球图等。下面是实现3D柱状图的代码示例: 1.安装插件 ``` npm install echarts-liquidfill --save ``` 2.引入插件 在main.js中引入插件 ``` import 'echarts-liquidfill'; ``` 3.使用echarts绘制3D柱状图 在组件中使用echarts绘制3D柱状图,代码如下: ``` <template> <div id="bar-chart"></div> </template> <script> import echarts from 'echarts'; export default { mounted() { this.drawChart(); }, methods: { drawChart() { // 初始化echarts var myChart = echarts.init(document.getElementById('bar-chart')); // 配置项 var option = { tooltip: {}, visualMap: { max: 100, inRange: { color: ['#00aaff', '#11ff00'] } }, xAxis3D: { type: 'category', data: ['A', 'B', 'C', 'D', 'E', 'F'] }, yAxis3D: { type: 'category', data: ['2019', '2020', '2021'] }, zAxis3D: { type: 'value' }, grid3D: { boxWidth: 200, boxDepth: 80, axisLine: { lineStyle: { color: '#999' } }, axisPointer: { lineStyle: { color: '#fff' } }, light: { main: { intensity: 1.2 }, ambient: { intensity: 0.3 } } }, series: [{ type: 'bar3D', data: [ ['A', '2019', 80], ['B', '2019', 50], ['C', '2019', 60], ['D', '2019', 70], ['E', '2019', 40], ['F', '2019', 30], ['A', '2020', 30], ['B', '2020', 70], ['C', '2020', 60], ['D', '2020', 40], ['E', '2020', 50], ['F', '2020', 30], ['A', '2021', 20], ['B', '2021', 40], ['C', '2021', 50], ['D', '2021', 80], ['E', '2021', 90], ['F', '2021', 70] ], shading: 'lambert', label: { textStyle: { fontSize: 16, borderWidth: 1 } }, itemStyle: { opacity: 0.8 } }] }; // 绘制图表 myChart.setOption(option); } } } </script> <style scoped> #bar-chart { width: 600px; height: 500px; } </style> ``` 以上代码通过echarts提供的3D柱状图配置项及series类型(bar3D),实现了一个简单的3D柱状图。最后,在图表容器中通过调用drawChart()方法来绘制图表即可。

“相关推荐”对你有帮助么?

  • 非常没帮助
  • 没帮助
  • 一般
  • 有帮助
  • 非常有帮助
提交
评论
添加红包

请填写红包祝福语或标题

红包个数最小为10个

红包金额最低5元

当前余额3.43前往充值 >
需支付:10.00
成就一亿技术人!
领取后你会自动成为博主和红包主的粉丝 规则
hope_wisdom
发出的红包

打赏作者

且陶陶º

感谢大人投喂~

¥1 ¥2 ¥4 ¥6 ¥10 ¥20
扫码支付:¥1
获取中
扫码支付

您的余额不足,请更换扫码支付或充值

打赏作者

实付
使用余额支付
点击重新获取
扫码支付
钱包余额 0

抵扣说明:

1.余额是钱包充值的虚拟货币,按照1:1的比例进行支付金额的抵扣。
2.余额无法直接购买下载,可以购买VIP、付费专栏及课程。

余额充值