


目录
0. 预览效果
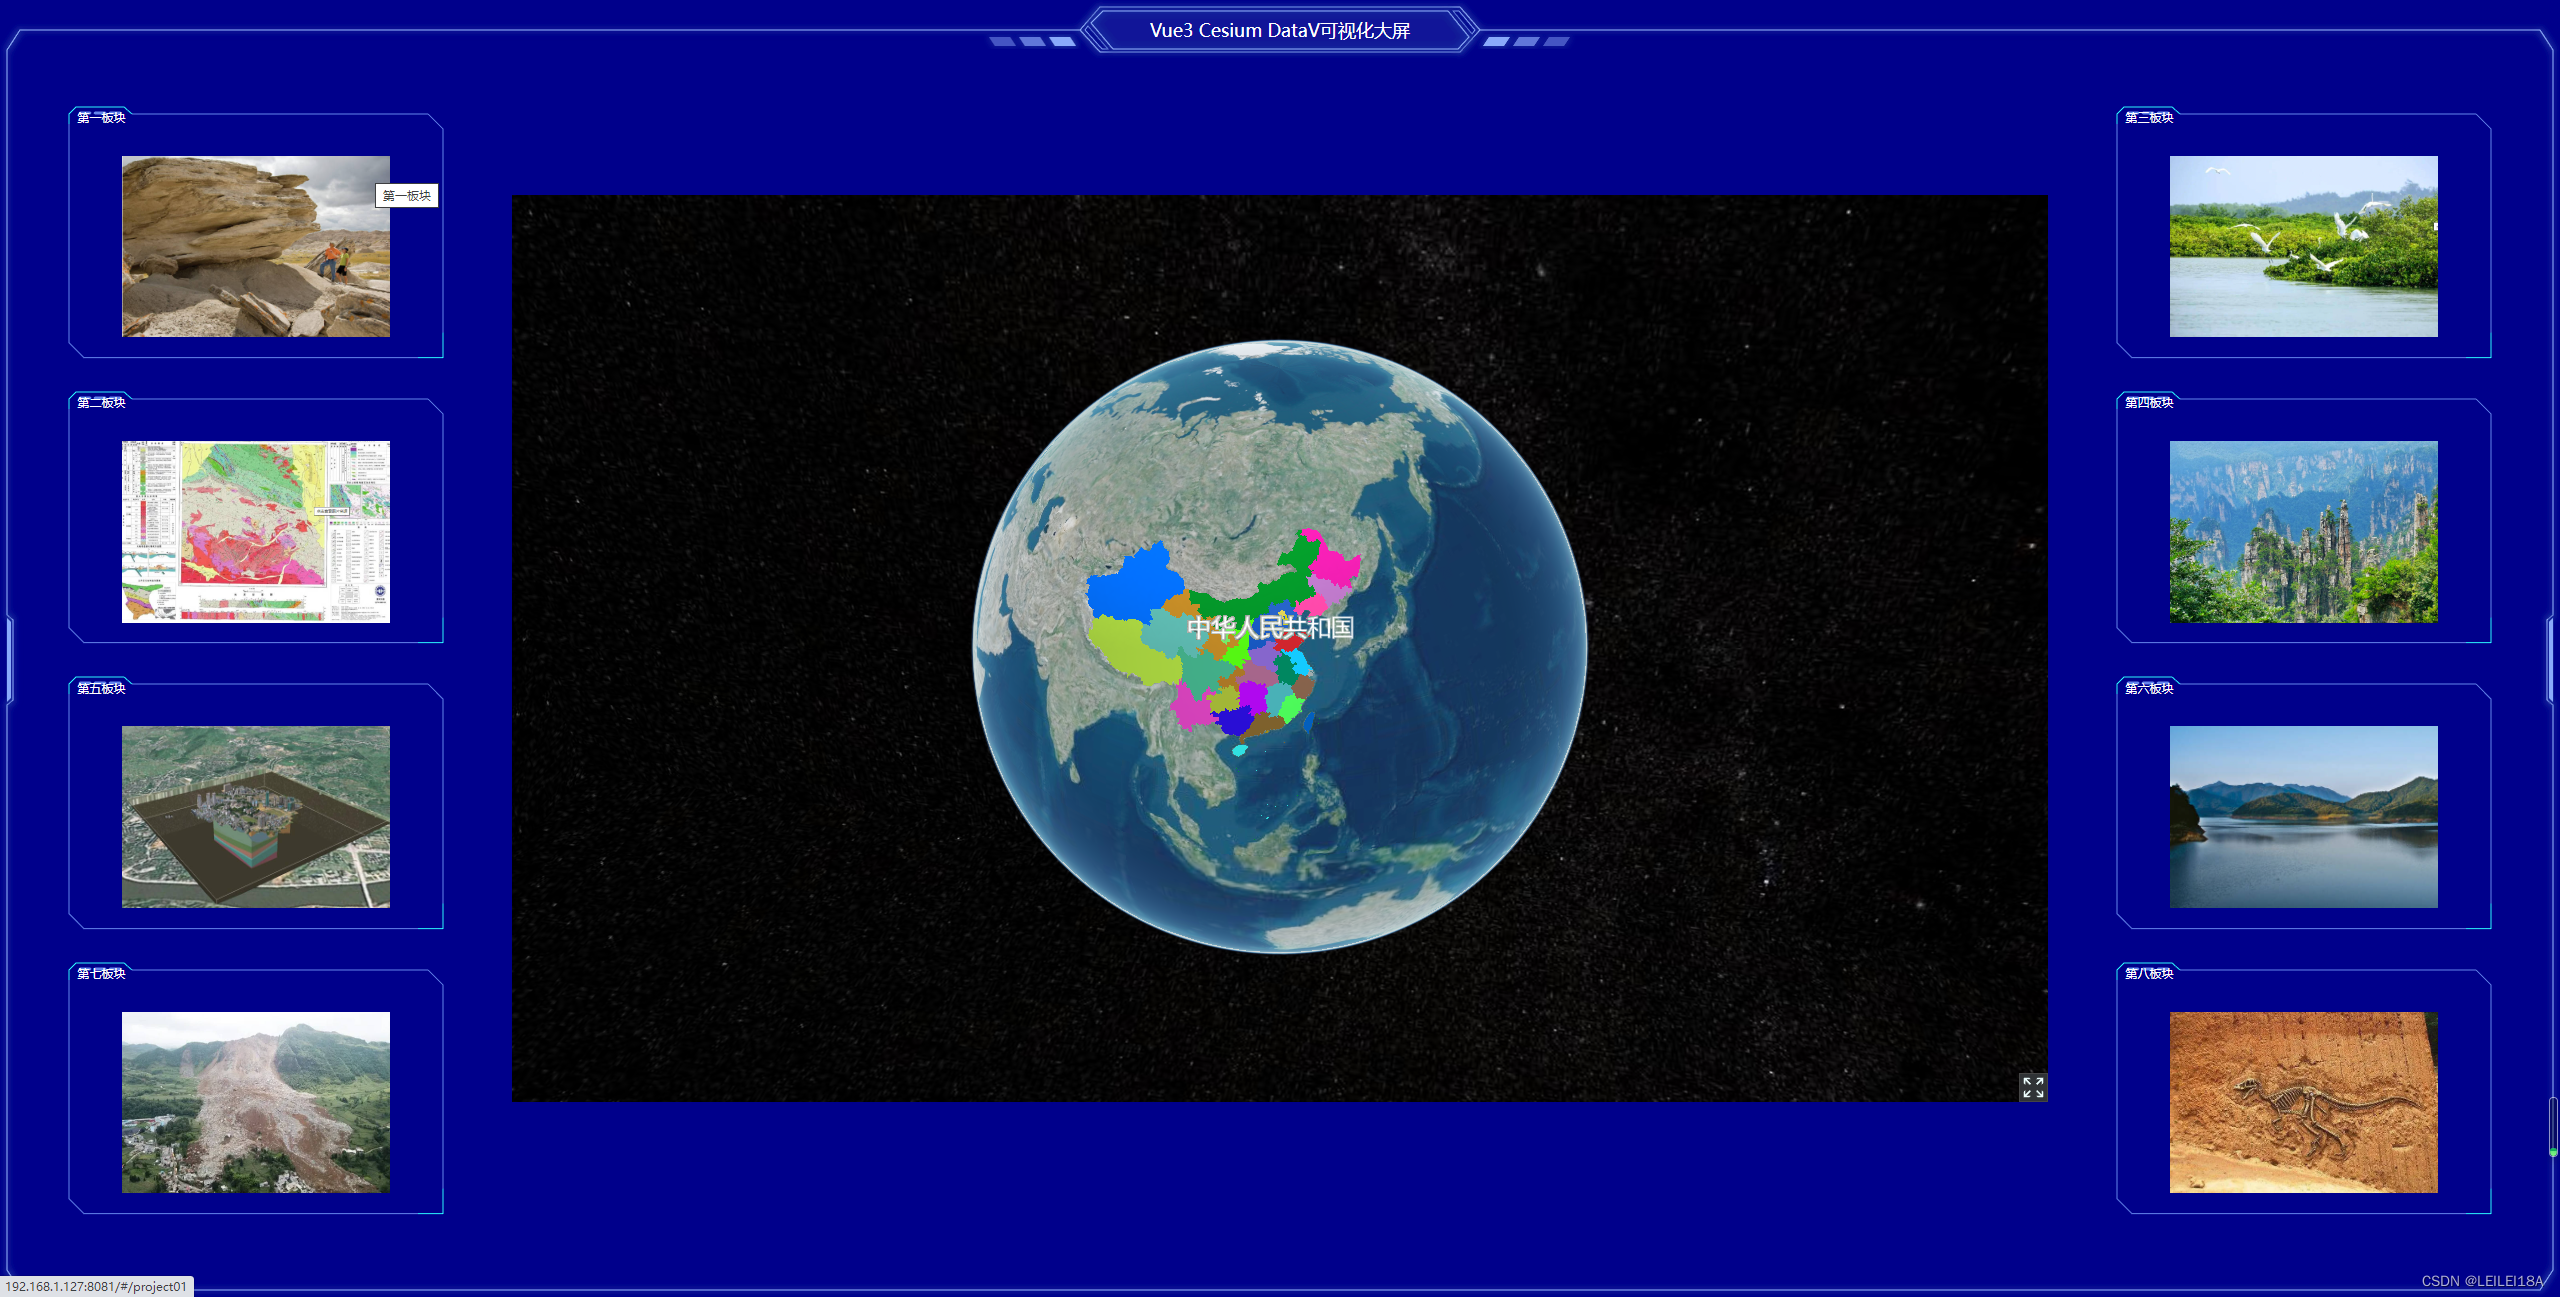
包含的功能:
① 地球按照一定速度自转
② 修改加载的geojson面样式
③ 添加 文字 标注!
1. 代码库包
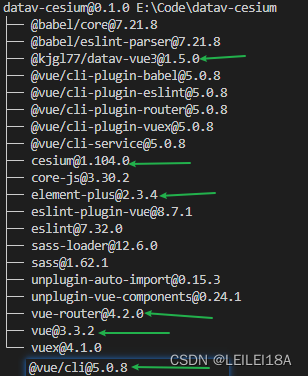
直接采用vue-cli5 创建项目,选择vue3,router,vuex等,然后这里选择的datav不是官方的,由于官方的datav-vue3有些问题,暂时采用的为DataV Vue3+TS+Vite版 | DataV - Vue3
2. 技术点
① css 父相子绝,父元素position: relative; 子元素position: absolute; datav中的BorderBox11,cesium中viewer的挂接的元素下面就有这种。
②这里布局写的有点随意,可以参考其他的可视化大屏的布局,多采用几行几列的形式如:"flex:0 1 50%";此外,这里数据都是写死的,后面可以通过配置数据库实现。
③css height top width left 等等 尽量按照 n%的形式。
3. 一些注意事项(配置参数)
项目采用的JavaScript,而非typescript!!!
①参考博主的另一篇关于vue3 cesium安装配置webpack的博客
② vue.config.js配置 直接复制上述博客的vue.config.js内容即可!
4. 相关代码详情

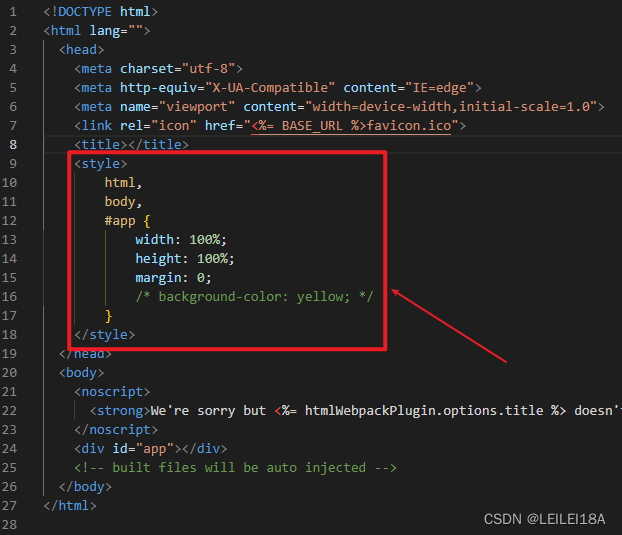
①index.html 修改
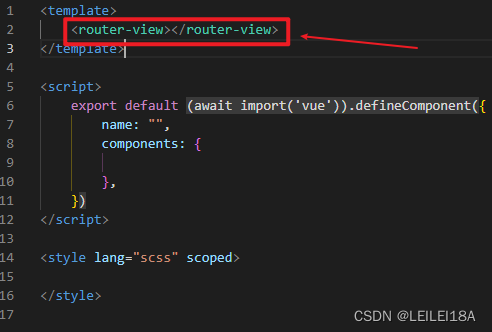
②App.vue
③HomeView.vue
<template>
<BorderBox11 id="container" title="Vue3 Cesium DataV可视化大屏" :title-width="400" :animate="false">
<div id="CesiumContainer"></div>
<router-link to="project01">
<BorderBox13 id="box01" title="第一板块" :title-width="200">
<div id="title">第一板块</div>
<img src="../../public/img01.jpg" alt="">
</BorderBox13>
</router-link>
<BorderBox13 id="box02" title="第二板块" :title-width="200">
<div id="title">第二板块</div>
<img src="../../public/img02.jpg" alt="">
</BorderBox13>
<BorderBox13 id="box03" title="第三板块" :title-width="200">
<div id="title">第三板块</div>
<img src="../../public/img03.jpg" alt="">
</BorderBox13>
<BorderBox13 id="box04" title="第四板块" :title-width="200">
<div id="title">第四板块</div>
<img src="../../public/img04.jpg" alt="">
</BorderBox13>
<router-link to="project05">
<BorderBox13 id="box05" title="第五板块" :title-width="200">
<div id="title">第五板块</div>
<img src="../../public/img05.jpg" alt="">
</BorderBox13>
</router-link>
<BorderBox13 id="box06" title="第六板块" :title-width="200">
<div id="title">第六板块</div>
<img src="../../public/img06.jpg" alt="">
</BorderBox13>
<BorderBox13 id="box07" title="第七板块" :title-width="200">
<div id="title">第七板块</div>
<img src="../../public/img07.jpg" alt="">
</BorderBox13>
<BorderBox13 id="box08" title="第八板块" :title-width="200">
<div id="title">第八板块</div>
<img src="../../public/img08.jpg" alt="">
</BorderBox13>
</BorderBox11>
</template>
<script>
import { BorderBox11, BorderBox13 } from '@kjgl77/datav-vue3';
import {reactive, ref, onMounted} from "vue";
// import * as Cesium from "cesium/Cesium.js";
// 改变了cesium alias的路径,采用推荐的import cesium,自动导入cesium/source/Cesium.js
import * as Cesium from "cesium";
// 导入cesium的css样式库,其实有点类似element-plus库全部导入时的样子
//import "cesium/Widgets/widgets.css";
import "cesium/Source/Widgets/widgets.css";
export default {
name: "App",
components: {
BorderBox11,
BorderBox13,
},
setup(){
var legend = reactive({});
// 地球旋转
function rotate(time, viewer) {
viewer.clock.multiplier = 300; //速度
viewer.clock.shouldAnimate = true;
var previousTime = viewer.clock.currentTime.secondsOfDay;
const onTickCallback = () => {
var spinRate = 1;
var currentTime = viewer.clock.currentTime.secondsOfDay;
var delta = (currentTime - previousTime) / 1000;
previousTime = currentTime;
viewer.scene.camera.rotate(Cesium.Cartesian3.UNIT_Z, -spinRate * delta);
}
// 开启地图自转效果
viewer.clock.onTick.addEventListener(onTickCallback);
};
const firstCesium = ()=>{
let viewer = new Cesium.Viewer("CesiumContainer", {
sceneModePicker: false,
navigationHelpButton: false,
baseLayerPicker: false,
animation: false,
timeline: false,
geocoder: false,
homeButton: false,
// infoBox: false,
});
// 设置自动旋转
rotate(4000, viewer);
// 设置背景颜色
// viewer.scene.skyBox.show = false;
// viewer.scene.backgroundColor = Cesium.Color.DARKBLUE;
// viewer.scene.sun.show = false;
// viewer.scene.moon.show = false;
// 去掉logo
viewer.cesiumWidget.creditContainer.style.display = "none";
// 去掉背景图层
// viewer.imageryLayers.removeAll();
// 鼠标右键 倾斜操作
viewer.scene.screenSpaceCameraController.tiltEventTypes = [
Cesium.CameraEventType.RIGHT_DRAG
];
// 鼠标滑轮 放缩操作
viewer.scene.screenSpaceCameraController.zoomEventTypes = [
Cesium.CameraEventType.WHEEL,
// Cesium.CameraEventType.PINCH
];
// 鼠标左键 3D下聚焦局部时给人感觉是平移-本质是地球旋转(范围小-旋转类似平移)
viewer.scene.screenSpaceCameraController.rotateEventTypes = [
Cesium.CameraEventType.LEFT_DRAG
];
let geojsonLayer = Cesium.GeoJsonDataSource.load(
"http://192.168.1.127:80/HeBei_DiZhi/ZG.json", // 这里是json文件的地址
).then((dataSource)=>{
const entities = dataSource.entities.values;
const colorHash = {};
for (let i = 0; i < entities.length; i++) {
//For each entity, create a random color based on the state name.
//Some states have multiple entities, so we store the color in a
//hash so that we use the same color for the entire state.
const entity = entities[i];
// console.log(i, entity);
const name = entity.name;
let color = colorHash[name];
if (!color) {
color = Cesium.Color.fromRandom({
alpha: 1.0,
});
legend[name] = color.toCssHexString();
colorHash[name] = color;
}
//Set the polygon material to our random color.
entity.polygon.material = color;
//Remove the outlines.
entity.polygon.outline = false;
// entity.polygon.extrudedHeight =
// entity.properties.Population / 50.0;
}
viewer.dataSources.add(dataSource);
viewer.entities.add({
position: Cesium.Cartesian3.fromDegrees(115, 38, 1000000, Cesium.Ellipsoid.WGS84),
label: {
text: "中华人民共和国",
showBackground: true,
fillColor: Cesium.Color.WHITE,
font: '24px sans-serif',
// pixelOffset: new Cesium.Cartesian2(20, -15),
// scaleByDistance: new Cesium.NearFarScalar(1.5e2, 2.0, 8e5, 0),
backgroundColor: Cesium.Color.TRANSPARENT,
}
});
})
};
onMounted(() => {
firstCesium()
});
return {
legend,
}
}
}
</script>
<style lang="scss" scoped>
#container {
position: relative;
height: 100%;
width: 100%;
background-color: darkblue;
}
#CesiumContainer {
position: absolute;
top: 15%;
left: 20%;
height: 70%;
width: 60%;
}
#box01 {
position: absolute;
top: 8%;
left: 2.5%;
height: 20%;
width: 15%;
}
#title {
position: absolute;
top: 2%;
left: 3.5%;
font-size: 0.4vh;
color: white;
}
#box02 {
position: absolute;
top: 30%;
left: 2.5%;
height: 20%;
width: 15%;
}
#box03 {
position: absolute;
top: 8%;
right: 2.5%;
height: 20%;
width: 15%;
}
#box04 {
position: absolute;
top: 30%;
right: 2.5%;
height: 20%;
width: 15%;
}
#box05 {
position: absolute;
top: 52%;
left: 2.5%;
height: 20%;
width: 15%;
}
#box06 {
position: absolute;
top: 52%;
right: 2.5%;
height: 20%;
width: 15%;
}
#box07 {
position: absolute;
top: 74%;
left: 2.5%;
height: 20%;
width: 15%;
}
#box08 {
position: absolute;
top: 74%;
right: 2.5%;
height: 20%;
width: 15%;
}
img {
position: absolute;
top: 20%;
left: 15%;
height: 70%;
width: 70%;
}
#legend {
position: absolute;
bottom: 100px;
right: 20px;
}
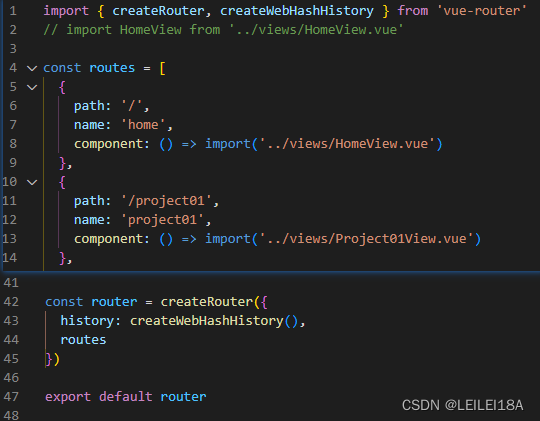
</style>④ router index.js


 1636
1636


 被折叠的 条评论
为什么被折叠?
被折叠的 条评论
为什么被折叠?
 到【灌水乐园】发言


