


自定义


x = linspace(0,pi);%生成一个从0开始到Π结束的向量,默认情况linspace会产生100个点
y1 = cos(x);
plot(x,y1)
hold on %通常与plot一起使用,用于在同一幅图上绘制多条曲线
y2 = cos(2*x);
plot(x,y2)
hold off%取消保持的状态,后续的plot命令将创建新的图形
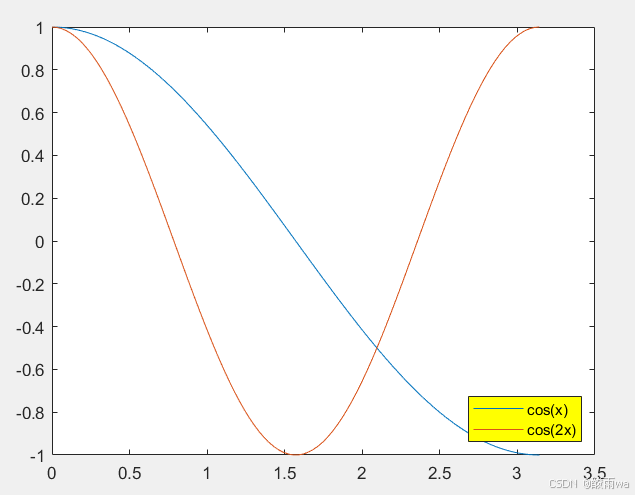
legend('cos(x)','cos(2x)')%为两条曲线分别创建标签,图例默认出现在图形的右上角。可以自定义图例的外观和位置
legend('cos(x)', 'cos(2x)', 'Location', 'southeast', 'Color', 'yellow');
%位置放在右下角,图例的背景色设置为黄色
在坐标区添加或删除数据序列,图例会相应地更新。创建数据序列时,可通过将 DisplayName 属性设置为名称-值对组来控制新数据序列的标签。如果您不指定标签,则图例使用 'dataN' 形式的标签。
y3 = cos(3*x);
plot(x,y3,'DisplayName','cos(3x)')
hold off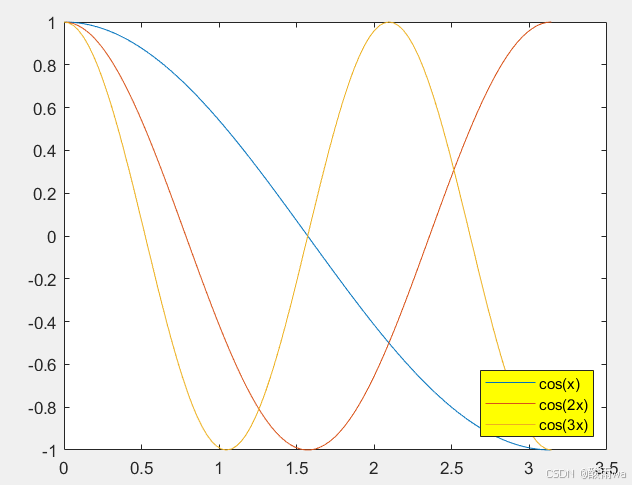
删除图例
legend('off')也可以直接通过DisplayName属性设置为所需的文本
x = linspace(0,pi);
y1 = cos(x);
plot(x,y1,'DisplayName','cos(x)')

hold on
y2 = cos(2*x);
plot(x,y2,'DisplayName','cos(2x)')
hold off

legend
若有多条曲线,但图例只表示其中几条, 将其标签指定为空字符向量或字符串。
x = 0:0.2:10;
plot(x,sin(x),x,sin(x+1));
hold on
yline(0,'--')
legend('sin(x)','sin(x+1)','') 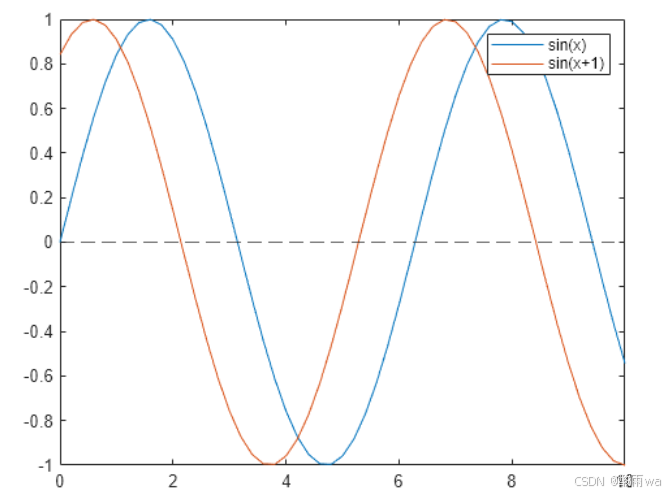
指定图例的列数,利用NumColums,默认图例从上到下从左到右排列
x = linspace(0,pi);
y1 = cos(x);
plot(x,y1)
hold on
y2 = cos(2*x);
plot(x,y2)
y3 = cos(3*x);
plot(x,y3)
y4 = cos(4*x);
plot(x,y4)
hold off
legend({'cos(x)','cos(2x)','cos(3x)','cos(4x)'},...
'Location','northwest','NumColumns',2)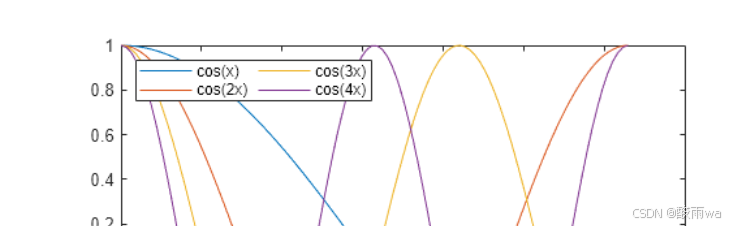 在两个或者多个图之间共享一个图例时,可以将图例放置在图块网格中,或放置在外侧图块中。
%tiledlayout函数用于创建一个包含了多个图块的图形布局
%创建了一个流式布局('flow'),其中图块之间紧密排列('TileSpacing','compact')。这种布局会根据图块的数量自动调整布局的方向(水平或垂直)'TileSpacing','compact' 使得图块之间的间距尽可能小。
t = tiledlayout('flow','TileSpacing','compact');
%nexttile 命令用于移动到下一个图块,并在该图块上绘制图形
nexttile
plot(rand(5))
nexttile
plot(rand(5))
nexttile
plot(rand(5))
%%
%添加一个共享图例
lgd = legend;
lgd.Layout.Tile = 4;
%%
%添加第四个绘图,并将图例移到east图块
nexttile
plot(rand(5))
lgd.Layout.Tile = 'east';
%rand(5)是生成一个5x5的矩阵,若只想生成五个随机数,可以randomNumbers = rand(1, 5);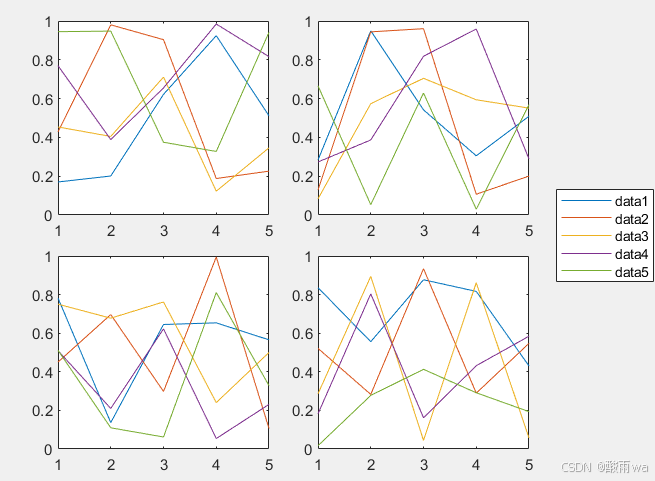 c
c
创建一个含LaTeX标记的图例
调用 legend 函数并将 Interpreter 属性设置为 'latex' 来添加包含 LaTeX 标记的图例。用美元符号 ($) 将标记括起来。
x = 0:0.1:10;
y = sin(x);
dy = cos(x);
plot(x,y,x,dy);
legend('$sin(x)$','$\frac{d}{dx}sin(x)$','Interpreter','latex');
为图例创建标题
lgd = legend('cos(x)','cos(2x)');
title(lgd,'My Legend Title')
删除图例的背景
legend('boxoff')指定图例的字体大小和颜色
调用 legend 时通过指定名称-值参量来设置属性,也可以在调用 legend 后设置 Legend 对象的属性。
rdm = rand(4);
plot(rdm)

lgd = legend({'Line 1','Line 2','Line 3','Line 4'},...
    'FontSize',12,'TextColor','blue');
lgd.NumColumns = 2;%图例为2列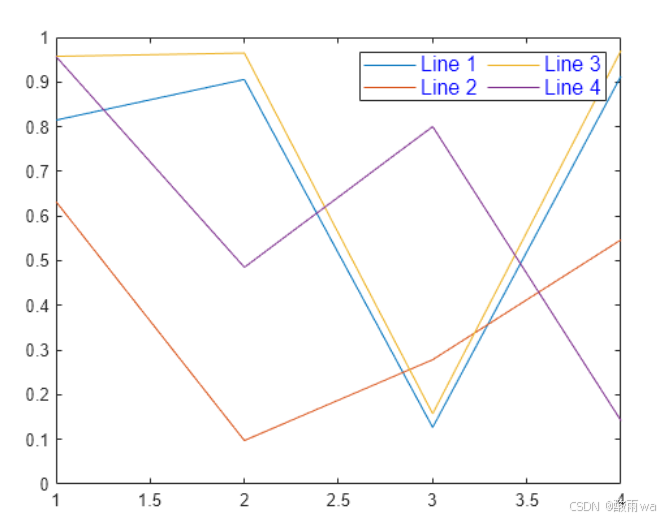
指定图例图标的宽度
x = 1:50;
sample1 = x + randn(1,50);
sample2 = (x-5) + randn(1,50);
y = x - 10;

% Plot the data
plot(x,y)
hold on
scatter(x,sample1,"filled")%以填充的方式绘制x和sample1的散点图
scatter(x,sample2,"filled")%以填充的方式绘制x和sample1的散点图
hold off
lgd = legend("Expected","Sample 1","Sample 2");%三个图例的名称
lgd.Location = "north";
lgd.Orientation = "horizontal";%将图例的排列方向设置为水平
lgd.IconColumnWidth = 10;%设置图例图标宽度为10
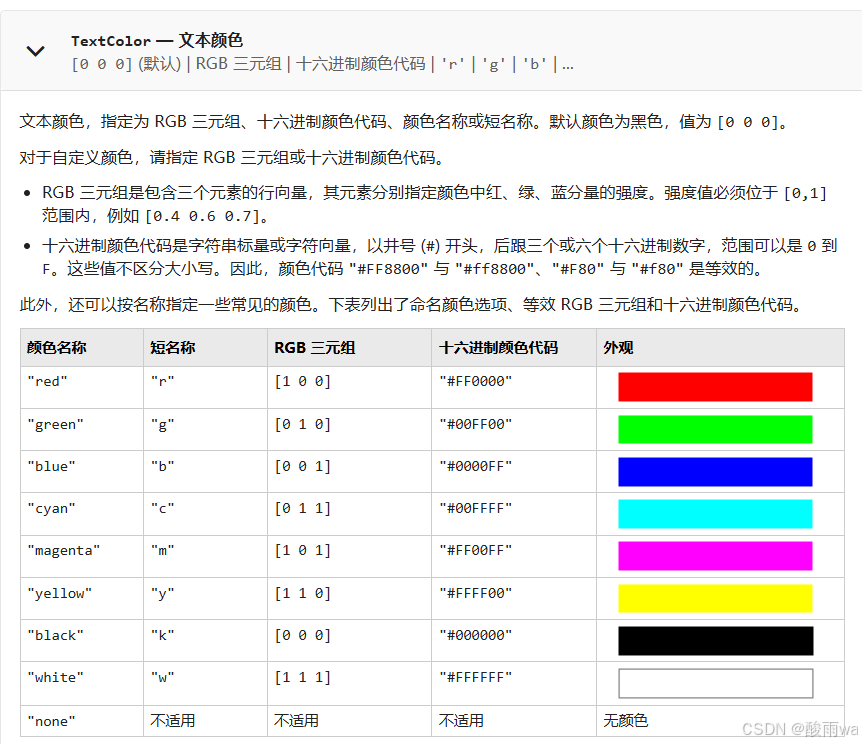 采用三种方式指定颜色
1、利用预定义的颜色名称,如“red”、“blue”、“green”
x = linspace(0, 2*pi, 100);
y1 = sin(x);
y2 = cos(x);

figure;
plot(x, y1, 'r'); % 红色
hold on;
plot(x, y2, 'b'); % 蓝色
hold off;
2、利用RGB
x = linspace(0, 2*pi, 100);
y1 = sin(x);
y2 = cos(x);

figure;
plot(x, y1, 'Color', [1, 0, 0]); % 纯红色
hold on;
plot(x, y2, 'Color', [0, 0, 1]); % 纯蓝色
hold off;
3、利用 十六进制颜色代码
x = linspace(0, 2*pi, 100);
y1 = sin(x);
y2 = cos(x);

figure;
plot(x, y1, 'Color', '#FF0000'); % 十六进制红色
hold on;
plot(x, y2, 'Color', '#0000FF'); % 十六进制蓝色
hold off;


 1万+
1万+

 被折叠的 条评论
为什么被折叠?
被折叠的 条评论
为什么被折叠?
 到【灌水乐园】发言


