


函数功能
Matlab自带绘图函数,坐标轴不带箭头,如下所示:
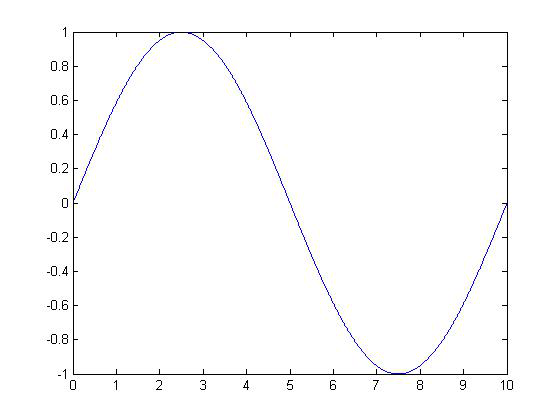
有时经常需要使用Matlab绘制坐标轴带有箭头的图形,特别是一些原理性的图形,只需要定性表达曲线的变化趋势,无需精确表达曲线的数量关系,这时使用带箭头的坐标轴显得更加美观。本程序可实现绘制坐标轴带有箭头的图形,程序调用格式与系统自带的绘图函数plot等一致,使用起来相当方便。


实现原理
使用系统函数绘图,在生成的图形上叠加两个annotation对象表示x轴和y轴,定义对象位置和样式使其显示为带箭头坐标轴的样子。
程序文件说明
| 函数名称 | 函数功能 | 备注 |
| plot_with_arrow | 绘图主函数 | 调用格式见函数头 |
| plot_with_arrow_Test | plot_with_arrow的测试程序 | 测试请运行此文件 |
| Arrow_Title | 设置箭头坐标轴图形的标题 | 与系统函数title类似 |
| Arrow_XY | 确定坐标轴箭头的起始位置 |
|
| Arrow_Xlabel | 设置箭头坐标轴图形的x轴标签 | 与系统函数xlabel类似 |
| Arrow_Ylabel | 设置箭头坐标轴图形的y轴标签 | 与系统函数ylabel类似 |
| stem_self | 自定义stem函数,去除stem函数中的0位线,不适合大数据量绘图 | 用于测试程序中 |
| isaxes | 判断对象是否为坐标轴(axes)对象 |
|
| isfigure | 判断对象是否为图形(figure)对象 |
|
| ischild | 判断对象是否为另一对象的子对象 |
|
测试程序
测试1:带箭头属性绘图
clc

clear

x  = linspace(0,10,1000);

y  = sin(2*pi*0.1*x);

Attribute_Set = {'LineWidth',1.5};        % 箭头属性及其取值,设置箭头宽度为1.5

[h h_a h_p h_arrow] = plot_with_arrow( [],x,y,'k',[],[],Attribute_Set );  % 绘图

htext_x = Arrow_Xlabel([],'时间/s',[]);       % x轴标签

htext_y = Arrow_Ylabel([],'幅值/V',[]);      % y轴标签

htext_title = Arrow_Title([],'图形Test');     % 图形标题
测试2:用数值指示箭头坐标轴位置
clc

clear

x  = linspace(0,10,1000);

y  = sin(2*pi*0.1*x);

figure

ha1 = subplot(211);          % 获取坐标轴句柄

pos = [0.1 0.7 1 1 0.1 0.7];       % 坐标轴位置

[h h_a h_p h_arrow] = plot_with_arrow( ha1,x,y,'k',pos );  % 直接输入坐标轴位置,暂不支持箭头坐标轴位置输入数值情况

htext_x = Arrow_Xlabel([],'时间/s',pos);

htext_y = Arrow_Ylabel([],'幅值/V',pos);

htext_title = Arrow_Title([],'图形Test');

ha2 = subplot(212);          % 获取坐标轴句柄

pos = [0.8 0.2 0.1 0.6 0.8 0.2];                                        % 坐标轴位置

[h h_a h_p h_arrow] = plot_with_arrow( ha2,x,y,'k',pos );  % 直接输入坐标轴位置,暂不支持箭头坐标轴位置输入数值情况

htext_x = Arrow_Xlabel([],'时间/s',pos);

htext_y = Arrow_Ylabel([],'幅值/V',pos);

htext_title = Arrow_Title([],'图形Test');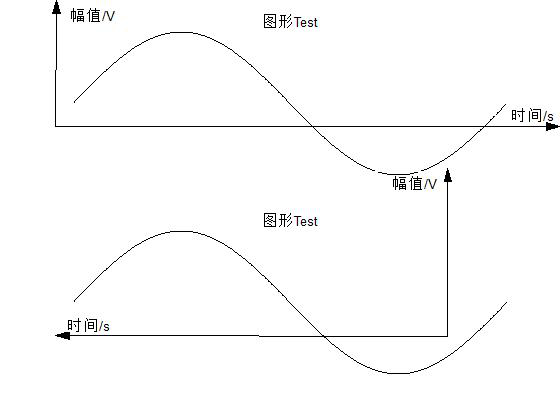
测试3:用数值指示箭头坐标轴位置
clc

clear

x  = linspace(0,10,1000);

y  = sin(2*pi*0.1*x);

h_f = figure;                                               %获取图形句柄

[h h_a h_p] = plot_with_arrow( h_f,x,y,'k' );   %绘图

htext_x = Arrow_Xlabel([],'时间/s',[]);

htext_y = Arrow_Ylabel([],'幅值/V',[]);

htext_title = Arrow_Title([],'图形Test');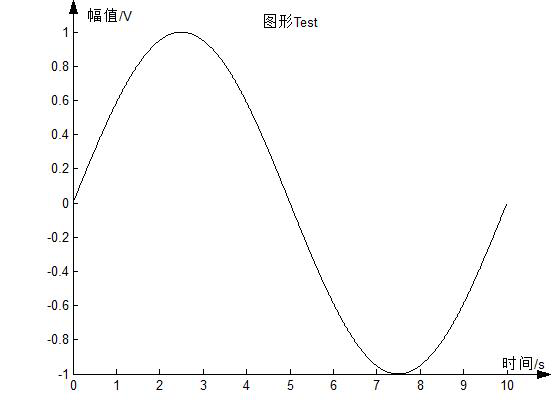
测试4:输入坐标轴句柄
clc

clear

x  = linspace(0,10,1000);

y  = sin(2*pi*0.1*x);

figure

h_a = subplot(211);           % 获取坐标轴句柄

[h h_a h_p] = plot_with_arrow( h_a,x,y,'k' );

htext_x = Arrow_Xlabel([],'时间/s',[]);

htext_y = Arrow_Ylabel([],'幅值/V',[]);

htext_title = Arrow_Title([],'图形Test1');

h_a2 = subplot(212);          % 获取坐标轴句柄

[h h_a h_p] = plot_with_arrow( h_a2,x,y,'k','nn' );

htext_x = Arrow_Xlabel([],'时间/s','nn');

htext_y = Arrow_Ylabel([],'幅值/V','nn');

htext_title = Arrow_Title([],'图形Test2');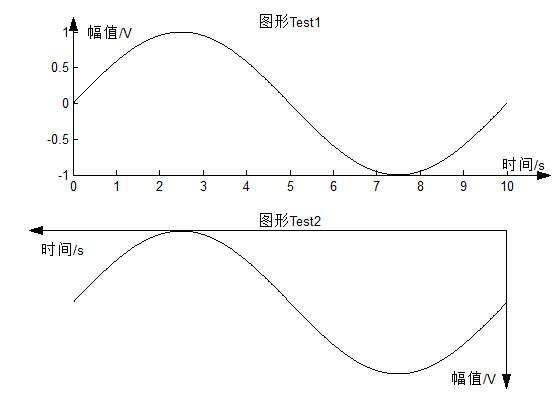
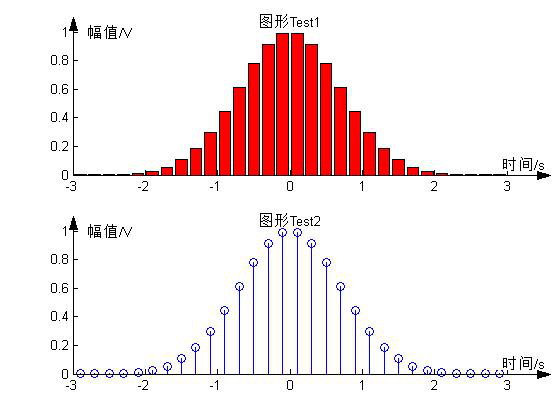
测试5:其它绘图函数
clc

clear

x = -2.9:0.2:2.9;

y = exp(-x.*x);

figure

h_a = subplot(211);

[h h_a h_p h_arrow] = plot_with_arrow( h_a,x,y,'r',[],@bar );         % 以bar函数绘直方图

htext_x = Arrow_Xlabel([],'时间/s',[]);

htext_y = Arrow_Ylabel([],'幅值/V',[]);

htext_title = Arrow_Title([],'图形Test1');

h_a2 = subplot(212);

[h h_a h_p h_arrow] = plot_with_arrow( h_a2,x,y,'b',[],@stem );     % 以stem函数画火柴杆图

htext_x = Arrow_Xlabel([],'时间/s',[]);

htext_y = Arrow_Ylabel([],'幅值/V',[]);

htext_title = Arrow_Title([],'图形Test2');
测试6:绘制光坐标轴,hold on之后再绘制图形
pos = 'an';

[h ha hp h_arrow]  = plot_with_arrow([],[],[],[],pos);    % 绘制光坐标轴

hold on

t = linspace(0,4*pi,200);

x = sin(t);

plot(t,x)                % 绘制图形

htext_x = Arrow_Xlabel([],'时间/s',pos);

htext_y = Arrow_Ylabel([],'幅值/V',pos);

htext_title = Arrow_Title([],'图形Test');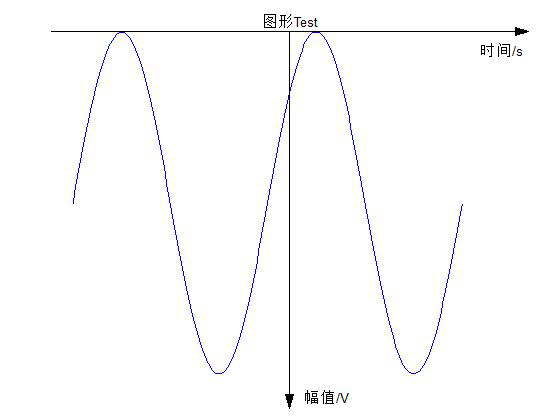
测试7:综合绘制
clc

clear

x  = linspace(0,10,1000);

y  = sin(2*pi*0.1*x);

figure

h_a1 = subplot(221);

[h1 h_a1 h_p1 h_arrow1] = plot_with_arrow( h_a1,x,y,'r' );       % 不给出pos参数

htext_x1 = Arrow_Xlabel([],'时间/s',[]);

htext_y1 = Arrow_Ylabel([],'幅值/V',[]);

h_a2 = subplot(222);

pos2 = 'an';

[h2 h_a2 h_p2 h_arrow2] = plot_with_arrow( h_a2,x,y,'r',pos2 );  % 以字母组成方式给出pos参数an

htext_x2 = Arrow_Xlabel([],'时间/s',pos2);

htext_y2 = Arrow_Ylabel([],'幅值/V',pos2);

h_a3 = subplot(223);

pos3 = 'nn';

[h3 h_a3 h_p3 h_arrow3] = plot_with_arrow( h_a3,x,y,'r',pos3 );  % 以字母组成方式给出pos参数nn

htext_x3 = Arrow_Xlabel([],'时间/s',pos3);

htext_y3 = Arrow_Ylabel([],'幅值/V',pos3);

h_a4 = subplot(224);

pos4 = 'np';

[h4 h_a4 h_p4 h_arrow4] = plot_with_arrow( h_a4,x,y,'r',pos4 );       % 以字母组成方式给出pos参数np

htext_x4 = Arrow_Xlabel([],'时间/s',pos4);

htext_y4 = Arrow_Ylabel([],'幅值/V',pos4);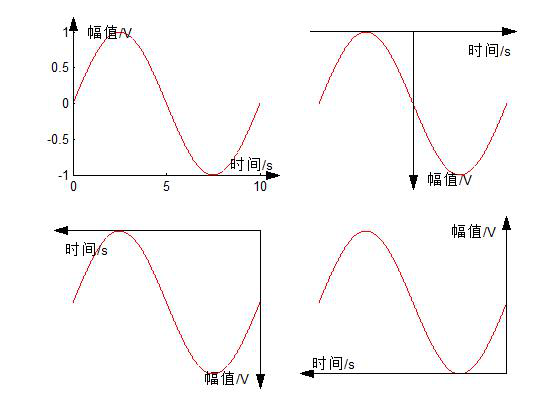
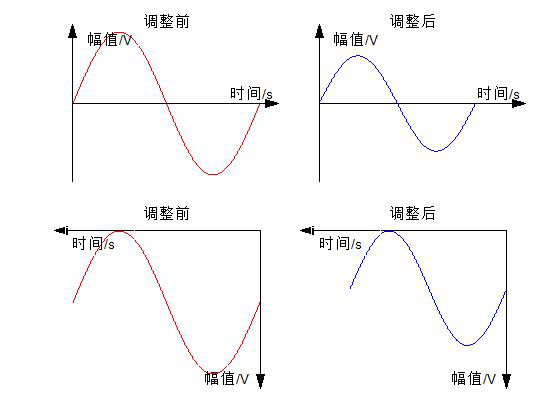
测试8:坐标调整
当坐标轴中的子对象(如曲线等)被Label对象挡住时,可通过axis或xlim、ylim调整坐标轴位置来消除这种影响 也可通过h_text_x/y句柄或是通过鼠标手动调整Label对象的位置
clc

clear

x  = linspace(0,10,1000);

y  = sin(2*pi*0.1*x);

figure

h_a1 = subplot(221);

[h1 h_a1 h_p1 h_arrow1] = plot_with_arrow( h_a1,x,y,'r','pa' );

htext_x1 = Arrow_Xlabel([],'时间/s','pa');

htext_y1 = Arrow_Ylabel([],'幅值/V','pa');

htext_title1 = Arrow_Title(h_a1,'调整前');

h_a2 = subplot(222);

[h2 h_a2 h_p2 h_arrow2] = plot_with_arrow( h_a2,x,y,'b','pa' );

htext_x2 = Arrow_Xlabel([],'时间/s','pa');

htext_y2 = Arrow_Ylabel([],'幅值/V','pa');

htext_title2 = Arrow_Title(h_a2,'调整后');

axes(h_a2)                % 使h_a2为当前坐标轴

axis([0 12 -1.5 1.5])    % 调整坐标轴,使Label不干扰图形

h_a3 = subplot(223);

pos3 = 'nn';

[h3 h_a3 h_p3 h_arrow3] = plot_with_arrow( h_a3,x,y,'r',pos3 );

htext_x3 = Arrow_Xlabel([],'时间/s',pos3);

htext_y3 = Arrow_Ylabel([],'幅值/V',pos3);

htext_title3 = Arrow_Title(h_a3,'调整前');

h_a4 = subplot(224);

[h4 h_a4 h_p4 h_arrow4] = plot_with_arrow( h_a4,x,y,'b',pos3 );

htext_x4 = Arrow_Xlabel([],'时间/s',pos3);

htext_y4 = Arrow_Ylabel([],'幅值/V',pos3);

htext_title4 = Arrow_Title(h_a4,'调整后');

axes(h_a4)                  % 使h_a4为当前坐标轴

axis([-2 10 -1.5 1])        % 调整坐标轴,使Label不干扰图形
测试9:修改箭头属性
x  = linspace(0,10,1000);

y  = sin(2*pi*0.1*x);

h_f = figure;

[h h_a h_p h_arrow] = plot_with_arrow( h_f,x,y,'k' );  % 绘制图形

htext_x = Arrow_Xlabel([],'时间/s',[]);

htext_y = Arrow_Ylabel([],'幅值/V',[]);

% 改变颜色

set( h_arrow,'color','r' )

% 修改箭头类型

set( h_arrow,'HeadStyle','vback3' )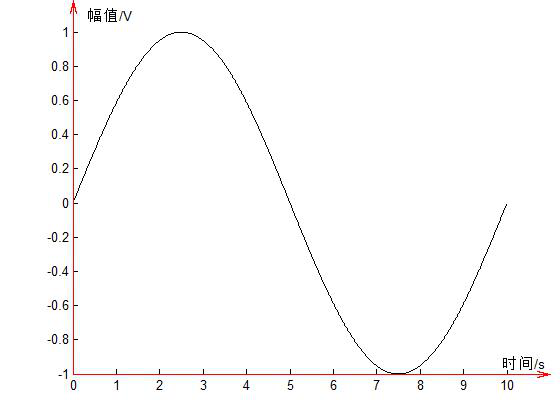
总结
annotation对象是figure的子对象,与axes级别相同,定义annotation对象位置是以figure窗口为参考。使用图形窗口的工具缩放坐标轴(axes)时,annotation对象的位置不会随之改变。
有Matlab/Simulink方面的技术问题,欢迎发送邮件至944077462@qq.com讨论。
更多Matlab/Simulink原创资料,欢迎关注微信公众号:Matlab Fans
源程序下载:
1. csdn资源: Matlab绘制箭头坐标轴图形
2. 扫码关注微信公众号Matlab Fans,回复BK02获取百度网盘下载链接。


 2668
2668


 被折叠的 条评论
为什么被折叠?
被折叠的 条评论
为什么被折叠?
 到【灌水乐园】发言


