


报错

右侧console 控制台向拖动 会报这个错误
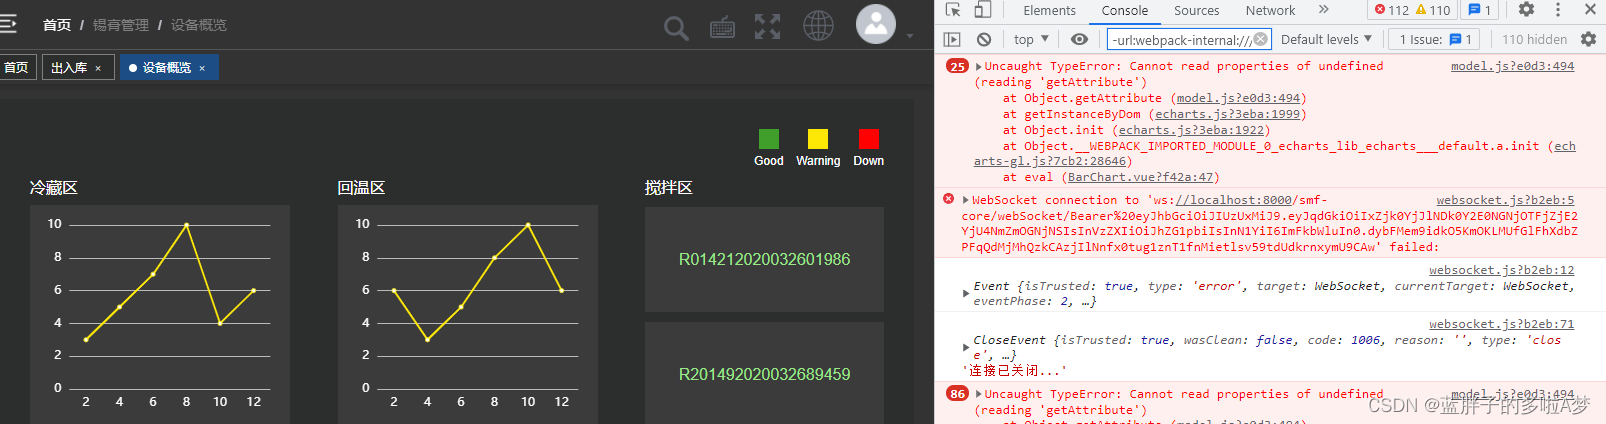
原因
原因是html的执行顺序是从上到下,在标签还没有加载的时候该方法就被调用了
加载顺序的问题
修改前:

修改后:
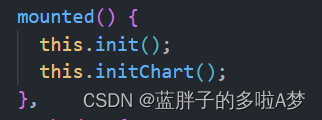
this.init(): 是 echart图根据窗口大小进行渲染的方法
this.initChart():是echart图进行初始化以及数据赋值渲染的方法
总结
this.init() 应放在数据方法前面调用(因为html的执行顺序是从上到下的)
完整代码
<template>
  <div
    class="chart"
    ref="Echart"
    :style="{ width: '240px', height: '200px' }"
  ></div>
</template>

<script>
export default {
  name: "lineChart",
  props: {
    //接受父组件传递来的数据
    labelList: Array,
    xAxisList: Array,
  },
  data() {
    return {};
  },
  watch: {
    labelList: function (newQuestion, oldQuestion) {
      this.initChart();
    },
  },
  mounted() {
    this.init();
    this.initChart();
  },
  methods: {
    init() {
      const self = this; //因为箭头函数会改变this指向,指向windows。所以先把this保存
      setTimeout(() => {
        window.addEventListener("resize", function () {
          self.chart = self.$echarts.init(self.$refs.Echart);
          self.chart.resize();
        });
      }, 10);
    },
    initChart() {
      // 创建 echarts 实例。
      var myChartOne = this.$echarts.init(this.$refs.Echart);
      myChartOne.setOption({
        //直角坐标系内绘图网格
        grid: {
          top: "5%",
          left: "3%", //grid 组件离容器左侧的距离
          right: "4%",
          bottom: "3%",
          containLabel: true, //grid 区域是否包含坐标轴的刻度标签
        },
        // 如果有多个同类组件,那么就是个数组。例如这里有三个 X 轴。
        xAxis: {
          type: "category",
          data: this.xAxisList,
          name: "data",
          axisLine: {
            show: false, //隐藏x轴线
            lineStyle: {
              color: "#ffffff",
            },
          },
          axisTick: {
            show: false, //隐藏x轴刻度
          },
        },

        yAxis: {
          type: "value",
          axisLine: {
            show: false,
            lineStyle: {
              color: "#ffffff",
            },
          },
          axisTick: {
            show: false, //隐藏y轴刻度
          },
          splitLine: {
            lineStyle: {
              // 设置背景横线
              color: "#BBBBBB",
            },
          },
        },
        series: [
          {
            data: this.labelList,
            type: "line",
            // smooth: true, //默认是false,判断折线连线是平滑的还是折线
            itemStyle: {
              normal: {
                color: "#FDE708", //改变折线点的颜色
                lineStyle: {
                  color: "#FDE708", //改变折线颜色
                },
              },
            },
          },
        ],
      });
    },
  },
};
</script>

<style>
</style>


 1万+
1万+


 被折叠的 条评论
为什么被折叠?
被折叠的 条评论
为什么被折叠?
 到【灌水乐园】发言


