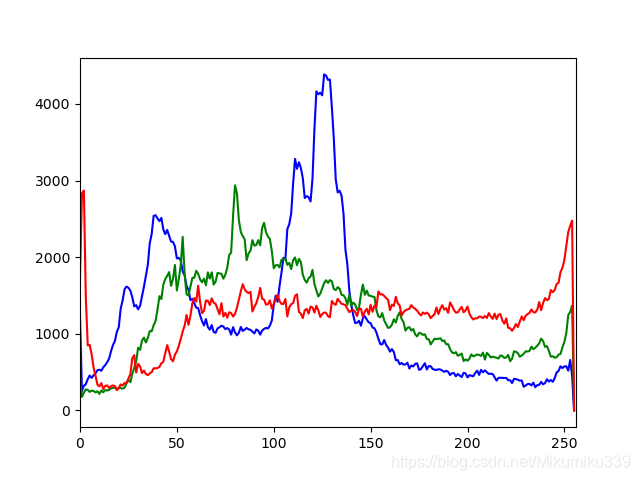
CV2实现
import cv2 as cv
import numpy as np
import matplotlib.pyplot as plt
%matplotlib qt5
img = cv.imread('111.jpg')
channels = ('b','g','r')
for i,c in enumerate(channels):
hist = cv.calcHist([img],[i],None,[256],[0,255])
plt.plot(hist,color=c)
plt.xlim([0,256])
plt.show()
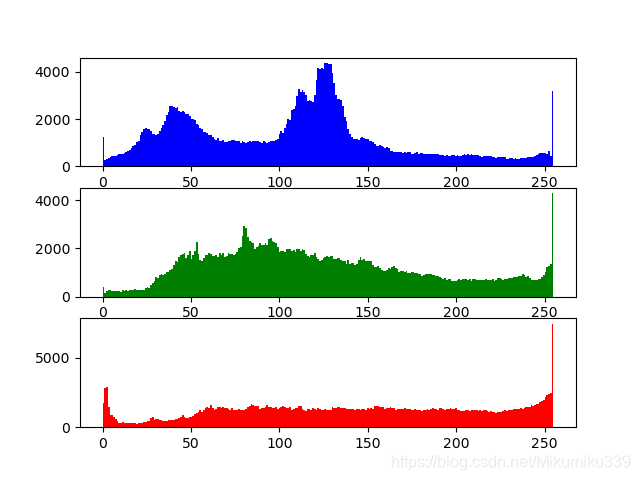
Matplotlib实现
import numpy as np
import cv2 as cv
from matplotlib import pyplot as plt
img = cv.imread('111.jpg')
plt.subplot(311)
plt.hist(img[...,0].ravel(),256,color='b')
plt.subplot(312)
plt.hist(img[...,1].ravel(),256,color='g')
plt.subplot(313)
plt.hist(img[...,2].ravel(),256,color='r')
plt.show()


 739
739


 被折叠的 条评论
为什么被折叠?
被折叠的 条评论
为什么被折叠?
 到【灌水乐园】发言


