


 本文介绍了如何在地图应用中使用SVG和GeoJSON数据动态显示路线轨迹线、箭头指示以及实时动画效果,同时提供清除数据的函数。作者详细展示了创建和管理这些图层的方法,包括轨迹边界、轨迹线、箭头图层和动态点的添加与清除过程。
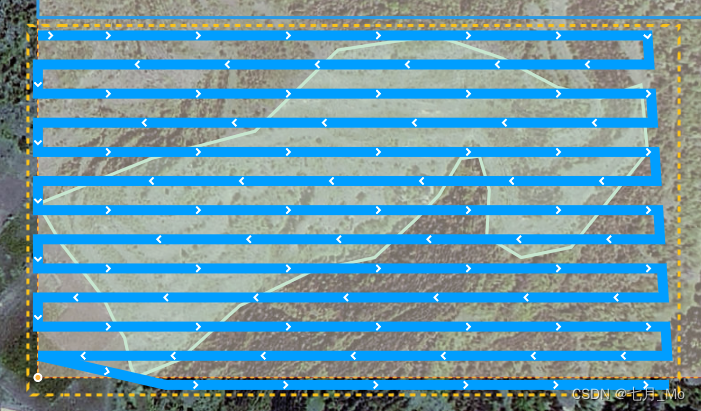
效果:
// 轨迹线
export const MAP_PATH_LINE = (values, layerId) => {
  // 箭头-右
  var svgXML = `<svg viewBox="0 0 1024 1024" xmlns="http://www.w3.org/2000/svg">
         <path d="M529.6128 512L239.9232 222.4128 384.7168 77.5168 819.2 512 384.7168 946.4832 239.9232 801.5872z" p-id="9085" fill="#ffffff"></path>
     </svg>
     `;
  //给图片对象写入base64编码的svg流
  var svgBase64 = 'data:image/svg+xml;base64,' + window.btoa(unescape(encodeURIComponent(svgXML)));

  let arrowIcon = new Image(20, 20);

  arrowIcon.src = svgBase64;

  arrowIcon.onload = function () {
    map.addImage('arrowIcon', arrowIcon);
    setRouteData();
    // map.loadImage('./car.png', function (error, carIcon) {
    //   if (carIcon) {
    //     map.addImage('carIcon', carIcon);
    //     setRouteData();
    //   }
    // });
  };

  var isPlay = true;
  var counter = 0;
  var steps = 0;
  let aLength = 0;
  let newRouteGeoJson;
  var routeGeoJson = values;

  var realRouteGeoJson = {
    type: 'FeatureCollection',
    features: [
      {
        type: 'Feature',
        geometry: {
          type: 'LineString',
          coordinates: [],
        },
      },
    ],
  };

  var animatePointGeoJson = {
    type: 'FeatureCollection',
    features: [
      {
        type: 'Feature',
        properties: {},
        geometry: {
          type: 'Point',
          coordinates: [],
        },
      },
    ],
  };

  // 获取轨迹边界
  var bbox = turf.bbox(routeGeoJson);

  map.fitBounds(
    [
      [Number(bbox[0]), Number(bbox[1])],
      [Number(bbox[2]), Number(bbox[3])],
    ],
    {
      padding: { top: 100, bottom: 100, left: 100, right: 100 },
      maxZoom: 16,
    },
  );

  // 获取轨迹数据
  function setRouteData() {
    animatePointGeoJson.features[0].geometry.coordinates = routeGeoJson.features[0].geometry.coordinates[0];
    aLength = routeGeoJson.features[0].geometry.coordinates.length;
    newRouteGeoJson = resetRoute(routeGeoJson.features[0], 1000, 'kilometers');
    steps = newRouteGeoJson.geometry.coordinates.length;

    addRouteBboxLayer(); // 添加轨迹边界图层
    addRoutelayer(); // 添加轨迹线图层
    // addRealRouteSource(); // 添加实时轨迹线图层
    addArrowlayer(); // 添加箭头图层
    // addAnimatePointSource(); // 添加动态点图层
  }

  // 添加轨迹边界图层
  function addRouteBboxLayer() {
    map.addLayer({
      id: 'routeBboxLayer',
      type: 'line',
      source: {
        type: 'geojson',
        data: turf.bboxPolygon(bbox),
      },
      paint: {
        'line-color': '#fbc219',
        'line-width': 3,
        'line-dasharray': [1, 1],
        'line-offset': -10,
      },
    });
  }

  // 添加轨迹线图层
  function addRoutelayer() {
    map.addLayer({
      id: 'routeLayer',
      type: 'line',
      source: {
        type: 'geojson',
        lineMetrics: true,
        data: routeGeoJson,
      },
      paint: {
        'line-width': 10,
        'line-opacity': 1,
        'line-color': '#009EFF',
      },
    });
  }

  // 添加实时轨迹线
  function addRealRouteSource() {
    map.addLayer({
      id: 'realRouteLayer',
      type: 'line',
      source: {
        type: 'geojson',
        lineMetrics: true,
        data: realRouteGeoJson,
      },
      paint: {
        'line-width': 10,
        'line-opacity': 1,
        'line-color': '#FF9900',
      },
    });
  }

  // 添加箭头图层
  function addArrowlayer() {
    map.addLayer({
      id: 'arrowLayer',
      type: 'symbol',
      source: {
        type: 'geojson',
        data: routeGeoJson, //轨迹geojson格式数据
      },
      layout: {
        'symbol-placement': 'line',
        'symbol-spacing': 50, // 图标间隔,默认为250
        'icon-image': 'arrowIcon', //箭头图标
        'icon-size': 0.5,
      },
    });
  }

  // 添加动态点图层
  function addAnimatePointSource() {
    map.addLayer({
      id: 'animatePointLayer',
      type: 'symbol',
      source: {
        type: 'geojson',
        data: animatePointGeoJson,
      },
      layout: {
        'icon-image': 'carIcon',
        'icon-size': 0.5,
        'icon-rotate': ['get', 'bearing'],
        'icon-rotation-alignment': 'map',
        'icon-allow-overlap': true,
        'icon-ignore-placement': true,
      },
    });

    animate();
  }

  function animate() {
    if (counter >= steps) {
      return;
    }

    var startPnt, endPnt;

    if (counter == 0) {
      realRouteGeoJson.features[0].geometry.coordinates = [];
      startPnt = newRouteGeoJson.geometry.coordinates[counter];
      endPnt = newRouteGeoJson.geometry.coordinates[counter + 1];
    } else if (counter !== 0) {
      startPnt = newRouteGeoJson.geometry.coordinates[counter - 1];
      endPnt = newRouteGeoJson.geometry.coordinates[counter];
    }

    animatePointGeoJson.features[0].properties.bearing = turf.bearing(turf.point(startPnt), turf.point(endPnt)) - 90;
    animatePointGeoJson.features[0].geometry.coordinates = newRouteGeoJson.geometry.coordinates[counter];
    realRouteGeoJson.features[0].geometry.coordinates.push(animatePointGeoJson.features[0].geometry.coordinates);

    map.getSource('animatePointLayer').setData(animatePointGeoJson);
    map.getSource('realRouteLayer').setData(realRouteGeoJson);

    if (isPlay) {
      requestAnimationFrame(animate);
    }

    counter = counter + 1;
  }

  function resetRoute(route, nstep, units) {
    var newroute = {
      type: 'Feature',
      geometry: {
        type: 'LineString',
        coordinates: [],
      },
    };
    var lineDistance = turf.lineDistance(route);
    var nDistance = lineDistance / nstep;

    for (let i = 0; i < aLength - 1; i++) {
      var from = turf.point(route.geometry.coordinates[i]);
      var to = turf.point(route.geometry.coordinates[i + 1]);
      let lDistance = turf.distance(from, to, {
        units: units,
      });

      if (i == 0) {
        newroute.geometry.coordinates.push(route.geometry.coordinates[0]);
      }

      if (lDistance > nDistance) {
        let rings = lineMore(from, to, lDistance, nDistance, units);

        newroute.geometry.coordinates = newroute.geometry.coordinates.concat(rings);
      } else {
        newroute.geometry.coordinates.push(route.geometry.coordinates[i + 1]);
      }
    }

    return newroute;
  }

  function lineMore(from, to, distance, splitLength, units) {
    var step = parseInt(distance / splitLength);
    var leftLength = distance - step * splitLength;
    var rings = [];
    var route = turf.lineString([from.geometry.coordinates, to.geometry.coordinates]);

    for (let i = 1; i <= step; i++) {
      let nlength = i * splitLength;
      let pnt = turf.along(route, nlength, {
        units: units,
      });

      rings.push(pnt.geometry.coordinates);
    }

    if (leftLength > 0) {
      rings.push(to.geometry.coordinates);
    }

    return rings;
  }
};
清除数据代码
// 清除轨迹
export const ClearTrackMap = () => {
  if (map?.hasImage('arrowIcon')) map?.removeImage('arrowIcon');
  if (map?.hasImage('carIcon')) map?.removeImage('carIcon');

  if (map.getLayer('routeBboxLayer')) map.removeLayer('routeBboxLayer');
  if (map.getSource('routeBboxLayer')) map.removeSource('routeBboxLayer');

  if (map.getLayer('routeLayer')) map.removeLayer('routeLayer');
  if (map.getSource('routeLayer')) map.removeSource('routeLayer');
  if (map.getLayer('realRouteLayer')) map.removeLayer('realRouteLayer');
  if (map.getSource('realRouteLayer')) map.removeSource('realRouteLayer');
  if (map.getLayer('arrowLayer')) map.removeLayer('arrowLayer');
  if (map.getSource('arrowLayer')) map.removeSource('arrowLayer');
  if (map.getLayer('animatePointLayer')) map.removeLayer('animatePointLayer');
  if (map.getSource('animatePointLayer')) map.removeSource('animatePointLayer');

  REMOVE_LAYER('vectorDataID');
  REMOVE_LAYER(`feature_0.1`);
};


 1441
1441


 被折叠的 条评论
为什么被折叠?
被折叠的 条评论
为什么被折叠?
 到【灌水乐园】发言


