


目录
前言
本文的主要内容是利用Python中的pandas库读取xlsx文件和csv文件中的数据,并存储为DataFrame结构的数据;然后进行一系列的数据清洗、格式转换、以及数据分组归类;接着利用matplotlib模块按照指定的格式绘制【分组柱状图】、【双轴分组柱状图】、【分组箱线图】、【分组散点图和分组箱线图叠加图】等。该程序可以批量绘制图片,此例子中的数据量可以绘制4000+张.jpg或.png图片,一般配置的电脑绘制**5000~10000+**张图片的体量是没有问题的。可以灵活运用在自动化办公领域!
一、项目背景:
1、项目描述:
此项目主要用来分析某苹果种植基地的苹果产量情况,其中涉及的参数包括不同区域施肥品种的不同对苹果产量的影响,还有good apple ratio(Gar)、bad apple number(Ban)、参数(Para)、影响因素占比(Arg)、影响因素个数(Argc)等情况的分析。
2、项目目的:
通过对不同区域的施肥情况(存在split.csv)中,还有相关区域的不同类型(Type)、不同的装箱(Box)中的苹果的数据进行分析整理并生成可视化图形具体分析影响苹果好坏的因素。
二、脚本主体逻辑架构
1、文件结构
(1)输入数据文件放在Input文件夹下,文件后缀名为.xlsx。
- 用来存放绘图的数据
(2)输入config文件放在config文件夹下,文件后缀名为.csv
- 用来设置绘图的类型
(3)输入split文件放在split文件夹下,文件后缀名为.csv
- 用来存放数据分组的规则
2、脚本主体逻辑框图如下所示:

三、使用步骤
1.引入库
代码如下:
import matplotlib
matplotlib.use('agg')
import matplotlib.pyplot as plt
import pandas as pd
import numpy as np
import glob
import os
import re
import datetime as dt
import chardet
import warnings
warnings.filterwarnings('ignore')
2.设置字体
代码如下:
# 设置字体, 解决中文乱码问题
plt.rcParams['font.sans-serif'] = ['Microsoft YaHei']
# 解决图像中的'-'负号的乱码问题
plt.rcParams['axes.unicode_minus'] = False
3、读入数据
代码如下:
# 获取当前脚本文件所在目录
path_current = os.getcwd()
# 获取当前脚本文件所在目录的上一级目录
path_pardir = os.path.dirname(path_current)
print(path_pardir)
file_lists_Input = glob.glob(path_pardir + '/Input/*.xlsx')
print(file_lists_Input)
file_lists_config = glob.glob(path_pardir + '/config/*.csv')
print(file_lists_config)
file_lists_split = glob.glob(path_pardir + '/split/*.csv')
print(file_lists_split)
4、编写一个可以自动识别文件编码格式的函数
代码如下:
# 自动识别文件编码格式
def get_encoding(file):
    with open(file, 'rb') as f:
        tmp = chardet.detect(f.read())
        return tmp['encoding']
5、编写一个可以进行数据格式转换的函数
代码如下:
# 数据格式转换
def data_format_exchange(data_list):
    for each_data in data_list:
        # 判断数据是否是字符串格式
        if isinstance(each_data, str):
            # 若数据是字符串格式, 再判断数据是否是带%
            if re.match(r'[\d.]+%', each_data, re.I):
                # 若带%, 去掉%后, 再转化成float型
                each_data_trans = float(each_data[:-1])
                # print('The type of the number {} is {}'.format(each_data_trans, type(each_data_trans)))
            else:
                # 若不带%, 直接转化成float型
                each_data_trans = float(each_data)
                # print('The type of the number {} is {}'.format(each_data_trans, type(each_data_trans)))
            index_num = data_list.index(each_data)
            data_list[index_num] = each_data_trans
6、编写一个获取config数据, 并存储在字典中的函数
代码如下:
# 获取config数据, 并存储在字典中
def get_config_data(file_list_config):
    for files in file_list_config:
        dict_config = {}
        encoding = get_encoding(files)
        print('$$$encoding:', encoding)
        pd.options.display.max_columns = None
        df = pd.read_csv(files, encoding=encoding)
        # print(df.tail())
        # print('#' * 50)
        dict_config.setdefault('Sort_Gar', {})
        dict_config.setdefault('Sort_Ban', {})
        dict_config.setdefault('Sort_Para', {})
        dict_config.setdefault('Sort_Arg', {})
        dict_config.setdefault('Sort_Argc', {})
        # print('$$$dict_config:', dict_config)
        for i in range(len(df['Sort_Gar'])):
            dict_config['Sort_Gar'].setdefault(df['Sort_Gar'][i], []).append(df['Gar_Item'][i])

        for i in range(len(df['Sort_Ban'])):
            dict_config['Sort_Ban'].setdefault(df['Sort_Ban'][i], []).append(df['Ban_Item'][i])

        for i in range(len(df['Sort_Para'])):
            dict_config['Sort_Para'].setdefault(df['Sort_Para'][i], []).append(df['Para_Item'][i])

        for i in range(len(df['Sort_Arg'])):
            dict_config['Sort_Arg'].setdefault(df['Sort_Arg'][i], []).append(df['Arg_Item'][i])

        for i in range(len(df['Sort_Argc'])):
            dict_config['Sort_Argc'].setdefault(df['Sort_Argc'][i], []).append(df['Argc_Item'][i])

        # 获取dict_config的key, 并存储在dict_config_keys中
        dict_config_keys = list(dict_config)
        # print('$$$dict_config_keys:', dict_config_keys)
        for dict_config_key in dict_config_keys:
            embedded_keys = list(dict_config[dict_config_key])
            for embedded_key in embedded_keys:
                if str(embedded_key) == 'nan':
                    del dict_config[dict_config_key][embedded_key]

        # print('###dict_config是:###', dict_config)
        return dict_config
7、编写一个获取split数据, 并存储在DataFrame中的函数
代码如下:
# 获取split数据, 并存储在DataFrame中
def get_split_data(file_list_split):
    for files in file_list_split:
        encoding = get_encoding(files)
        # print(encoding)
        pd.options.display.max_columns = None
        df_split = pd.read_csv(files, encoding=encoding)
        # 删除df_split中全为空的行
        df_split = df_split.dropna(axis=0, how='all')
        # print(df_split.head())
        # print('#' * 50)
        return df_split
8、编写一个获取Input数据, 并存储起来的函数
代码如下:
# 获取Input数据, 并存储起来
def get_Input_data(file_list_Input):
    for files in file_list_Input:
        # sheet_name=None可以让read_excel()函数读取该excel中所有的sheet
        df_input_dict = pd.read_excel(files, sheet_name=None)
        # print(list(df_input_dict.keys()))
        # df_Gar = df_input_dict['Gar']
        # df_Ban = df_input_dict['Ban']
        # df_Para = df_input_dict['Para']
        # df_Arg = df_input_dict['Arg']
        # df_Argc = df_input_dict['Argc']
        # print(df_Gar.head())
        # element = df_Gar['Apple_Large_4kg'][0]
        # print('The type of the element is:', type(element))
        # element_trans = df_Gar['Apple_Large_4kg'].astype(float)
        # print(type(element_trans))
        # cols = list(df_Gar)
        # print('The column label of the df is:', cols)
        # for i in df_Gar['Apple_Large_4kg']:
        #     i = float(i[:-1])
        #     print('The type of the number {} is {}'.format(i, type(i)))
        # data = df_Gar['Apple_Large_4kg']
        # data = df_Arg['SB']
        # data_format_exchange(data)
        # print(data)
        # print('#' * 50)
        return df_input_dict
9、编写一个绘图的父类
代码如下:
class BarchartFather:
    def __init__(self, Barchart_byGroup_xlabels, Barchart_byGroup_data, Barchart_byGroup_legend, title_name, picture_name, number, Barchart_byGroup_ylabels):
        self.local_path = path_pardir + '/output/' + str(Type_ID) + '_' + Nowtime + '/'
        self.Barchart_byGroup_xlabels = Barchart_byGroup_xlabels
        self.Barchart_byGroup_data = Barchart_byGroup_data
        self.Barchart_byGroup_legend = Barchart_byGroup_legend
        self.title_name = title_name
        self.picture_name = picture_name
        self.number = number
        self.Barchart_byGroup_ylabels = Barchart_byGroup_ylabels
        self.fig = plt.figure(figsize=(8, 6), facecolor='#B0C4DE')
        self.ax = self.fig.add_subplot(facecolor='white')
        ################################################################################################################
        # self.color_list = [深橙色, 纯蓝色, 纯绿色, 洋红色, 青色, 橙红色, 淡蓝色, 紫色, 纯红色, 酸橙色, 棕色, 淡珊瑚色,\
        #                    靛青色, 橄榄色, 水鸭色, 暗淡的灰色, 热情的粉红色, 兰花的紫色, 黑色, 深粉色, 淡钢蓝色, 橄榄土褐色,\
        #                    深紫罗兰色, 适中的紫色, 道奇蓝色]
        ################################################################################################################
        self.color_list = ['#FF8C00', '#0000FF', '#008000', '#FF00FF', '#00FFFF', '#FF4500', '#87CEFA', '#800080',
                           '#FF0000', '#00FF00', '#A52A2A', '#F08080', '#4B0082', '#808000', '#008080', '#696969',
                           '#FF69B4', '#DA70D6', '#000000', '#FF1493', '#B0C4DE', '#556B2F', '#9400D3', '#9370DB', '#1E90FF']
        self.length = len(self.Barchart_byGroup_xlabels)
        self.x_locs = np.arange(self.length)
        self.total_width = 0.8
        self.box_total_width = self.total_width * 0.85
        self.interval_total_width = self.total_width * 0.15
        self.width = self.total_width / self.number
        self.box_width = self.box_total_width / self.number
        ###################################################
        if self.number == 1:
            self.interval_width = self.interval_total_width
        else:
            self.interval_width = self.interval_total_width / (self.number - 1)
        ###################################################
        if self.number % 2 == 0:
            self.x1 = self.x_locs - (self.number / 2 - 1) * self.width - self.width / 2
            self.x1_box = self.x_locs - (self.number / 2 - 1) * self.box_width - self.box_width / 2 - (self.number / 2 - 1) * self.interval_width - self.interval_width / 2
        else:
            self.x1 = self.x_locs - ((self.number - 1) / 2) * self.width
            self.x1_box = self.x_locs - ((self.number - 1) / 2) * self.box_width - ((self.number - 1) / 2) * self.interval_width
        self.x_list = [self.x1 + self.width * i for i in range(self.number)]
        self.x_list_box = [self.x1_box + self.box_width * i + self.interval_width * i for i in range(self.number)]
        # print('$$$self.x_list:', self.x_list)
        # print('$$$self.x_list_box:', self.x_list_box)
10、编写一个sheet名为Gar的绘图的子类
代码如下:
class BarchartByGroupGar(BarchartFather):
    def __init__(self, Barchart_byGroup_xlabels, Barchart_byGroup_data, Barchart_byGroup_legend, title_name, picture_name, number, Barchart_byGroup_ylabels):
        super().__init__(Barchart_byGroup_xlabels, Barchart_byGroup_data, Barchart_byGroup_legend, title_name, picture_name, number, Barchart_byGroup_ylabels)
        self.ylabels = ['0%', '10%', '20%', '30%', '40%', '50%', '60%', '70%', '80%', '90%', '100%']
        self.y_locs = np.arange(0, 110, 10)

    def Bar_ByGroupGar(self):
        for i in range(self.number):
            Barchart_byGroup_data_tmp = self.Barchart_byGroup_data[i]
            data_format_exchange(Barchart_byGroup_data_tmp)
            #############################################################################
            # 判断用data_format_exchange函数转化之前的对象是否为字符串:1表示是, 0表示否
            each_Bbdt_flag = 0
            for each_Bbdt in Barchart_byGroup_data_tmp:
                if each_Bbdt > 1:
                    each_Bbdt_flag = 1
                    break

            if each_Bbdt_flag == 0:
                Barchart_byGroup_data_tmp1 = []
                for each_Bbdt in Barchart_byGroup_data_tmp:
                    each_Bbdt = each_Bbdt * 100
                    Barchart_byGroup_data_tmp1.append(each_Bbdt)
                Barchart_byGroup_data_tmp = Barchart_byGroup_data_tmp1
            #############################################################################
            # print('$$$len(self.x_list[i]):', len(self.x_list[i]))
            # print('$$$len(Barchart_byGroup_data_tmp):', len(Barchart_byGroup_data_tmp))
            self.ax.bar(self.x_list[i], Barchart_byGroup_data_tmp, color=self.color_list[i], width=self.width, label=self.Barchart_byGroup_legend[i])
        self.ax.grid(True, ls=':', color='b', alpha=0.3)
        plt.title(self.title_name, fontweight='bold', pad=25)
        self.ax.set_xticks(self.x_locs)
        self.ax.set_yticks(self.y_locs)
        self.ax.set_xticklabels(self.Barchart_byGroup_xlabels, rotation=90)
        self.ax.set_yticklabels(self.ylabels)
        self.ax.set_ylabel(self.Barchart_byGroup_ylabels, fontweight='bold')
        #################################################################################
        # 添加双轴
        ax_twinx = self.ax.twinx()
        #################################################################################
        # 准备好画LmaxRatio和LminRatio的数据
        Barchart_byGroup_data_Large = self.Barchart_byGroup_data[0]
        Barchart_byGroup_data_Middle = self.Barchart_byGroup_data[1]
        Barchart_byGroup_data_Small = self.Barchart_byGroup_data[2]
        data_format_exchange(Barchart_byGroup_data_Large)
        data_format_exchange(Barchart_byGroup_data_Middle)
        data_format_exchange(Barchart_byGroup_data_Small)
        LmaxRatio = []
        LminRatio = []
        for i in range(len(Barchart_byGroup_data_Large)):
            if Barchart_byGroup_data_Middle[i] == 0:
                LmaxRatio_tmp = 0
                LminRatio_tmp = 0
                LmaxRatio.append(LmaxRatio_tmp)
                LminRatio.append(LminRatio_tmp)
            else:
                LmaxRatio_tmp = (Barchart_byGroup_data_Large[i] / Barchart_byGroup_data_Middle[i]) * 100
                LminRatio_tmp = (Barchart_byGroup_data_Small[i] / Barchart_byGroup_data_Middle[i]) * 100
                LmaxRatio.append(LmaxRatio_tmp)
                LminRatio.append(LminRatio_tmp)
        #################################################################################
        # 画LmaxRatio和LminRatio
        ax_twinx.plot(self.x_locs, LmaxRatio, linestyle='-', marker='o', markersize=3, color=self.color_list[0], label='LmaxRatio')
        ax_twinx.plot(self.x_locs, LminRatio, linestyle='-', marker='o', markersize=3, color=self.color_list[2], label='LminRatio')
        ################################################################################################################
        ################################################################################################################
        self.fig.legend(loc='upper center', bbox_to_anchor=(0.5, 0.96), frameon=False, ncol=5, handlelength=0.9,
                        handleheight=0.9, fontsize='small')
        ################################################################################################################
        ################################################################################################################
        ax_twinx.set_ylabel('LminRatio, LmaxRatio', fontweight='bold')
        ################################################################################################################
        self.fig.tight_layout()
        ###########################################
        ###########################################
        self.fig.subplots_adjust(top=0.9)
        ###########################################
        ###########################################
        plt.savefig(self.local_path + self.picture_name + '.jpg', facecolor=self.fig.get_facecolor())
        plt.clf()
        plt.close(self.fig)
11、编写一个sheet名为Ban的绘图的子类
代码如下:
class BarchartByGroupBan(BarchartFather):
    def __init__(self, Barchart_byGroup_xlabels, Barchart_byGroup_data, Barchart_byGroup_legend, title_name, picture_name, number, Barchart_byGroup_ylabels):
        super().__init__(Barchart_byGroup_xlabels, Barchart_byGroup_data, Barchart_byGroup_legend, title_name, picture_name, number, Barchart_byGroup_ylabels)

    def Bar_ByGroupBan(self):
        for i in range(self.number):
            Barchart_byGroup_data_tmp = self.Barchart_byGroup_data[i]
            data_format_exchange(Barchart_byGroup_data_tmp)
            self.ax.bar(self.x_list[i], Barchart_byGroup_data_tmp, color=self.color_list[i], width=self.width, label=self.Barchart_byGroup_legend[i])
        self.ax.grid(True, ls=':', color='b', alpha=0.3)
        plt.title(self.title_name, fontweight='bold', pad=25)
        self.ax.set_xticks(self.x_locs)
        self.ax.set_xticklabels(self.Barchart_byGroup_xlabels, rotation=90)
        self.ax.set_ylabel(self.Barchart_byGroup_ylabels, fontweight='bold')
        ################################################################################################################
        ################################################################################################################
        self.fig.legend(loc='upper center', bbox_to_anchor=(0.5, 0.96), frameon=False, ncol=5, handlelength=0.9,
                        handleheight=0.9, fontsize='small')
        ################################################################################################################
        ################################################################################################################
        self.fig.tight_layout()
        #############################################
        #############################################
        self.fig.subplots_adjust(top=0.9)
        #############################################
        #############################################
        plt.savefig(self.local_path + self.picture_name + '.jpg', facecolor=self.fig.get_facecolor())
        plt.clf()
        plt.close(self.fig)
12、编写一个sheet名为Para的绘图的子类
代码如下:
class BarchartSinglePara(BarchartFather):
    def __init__(self, Barchart_xlabels, Barchart_data, Barchart_legend, title_name, picture_name, number, Barchart_ylabels, Barchart_legend_title):
        super().__init__(Barchart_xlabels, Barchart_data, Barchart_legend, title_name, picture_name, number, Barchart_ylabels)
        self.Barchart_legend_title = Barchart_legend_title

    def Bar_Para(self):
        # each_legend_number用来存放每个legend对应的柱子的数量, 注意这个数量list是累加的
        # 形如[num1, num1 + num2, num1 + num2 + num3, ...]
        each_legend_number = []
        # color_index用来存放color_list中每个color的索引
        color_index = []
        each_legend_number_sum = 0
        for i in self.Barchart_byGroup_legend:
            each_legend_number_tmp = len(self.Barchart_byGroup_data[i])
            each_legend_number_sum = each_legend_number_sum + each_legend_number_tmp
            each_legend_number.append(each_legend_number_sum)
        for i in range(len(self.Barchart_byGroup_legend)):
            color_index.append(i)
        # cut_index用来列表切片
        cut_index = 0
        # count_index用来计算列表切片时是否已经切到最后一段, 因为最后一段的切片方式和其他段不同, 要用[start_index:]
        count_index = 1
        for color_i, legend_n, each_legend in zip(color_index, each_legend_number, self.Barchart_byGroup_legend):
            Barchart_byGroup_data_tmp = self.Barchart_byGroup_data[each_legend]
            data_format_exchange(Barchart_byGroup_data_tmp)
            ############################################################################################################
            ############################################################################################################
            ###################### 注意如下两句语句的区别, 很容易出错 #######################################################
            ############# print('$$$self.x_list[cut_index:legend_n]:', self.x_list[cut_index:legend_n]) ################
            ############# print('$$$self.x_list[cut_index:legend_n]:', self.x_list[0][cut_index:legend_n]) #############
            ############################################################################################################
            ############################################################################################################
            # 如果legend的值为None, 就把legend设为空值
            if each_legend == 'None':
                each_legend = ' '
            if count_index == len(self.Barchart_byGroup_legend):
                self.ax.bar(self.x_list[0][cut_index:], Barchart_byGroup_data_tmp, color=self.color_list[color_i],
                            width=self.width, label=each_legend)
            else:
                self.ax.bar(self.x_list[0][cut_index:legend_n], Barchart_byGroup_data_tmp,
                            color=self.color_list[color_i], width=self.width, label=each_legend)
            cut_index = legend_n
            count_index += 1
        self.ax.grid(True, ls=':', color='b', alpha=0.3)
        plt.title(self.title_name, fontweight='bold')
        self.ax.set_xticks(self.x_locs)
        self.ax.set_xticklabels(self.Barchart_byGroup_xlabels, rotation=90)
        self.ax.set_ylabel(self.Barchart_byGroup_ylabels, fontweight='bold')
        ################################################################################################################
        ################################################################################################################
        ########## 注意如下两句语句的区别, 很容易出错! ######################################################################
        ########## plt.legend(title=self.Barchart_legend_title, loc='center left', bbox_to_anchor=(1.02, 0.5), #########
        ##########           facecolor='None', edgecolor='#000000', frameon=True, ncol=1, handlelength=0.9, ############
        ##########           handleheight=0.9, borderaxespad=0) ########################################################
        ################################################################################################################
        ########## self.fig.legend(title=self.Barchart_legend_title, loc='center left', bbox_to_anchor=(1.02, 0.5), ####
        ##########           facecolor='None', edgecolor='#000000', frameon=True, ncol=1, handlelength=0.9, ############
        ##########           handleheight=0.9, borderaxespad=0) ########################################################
        ################################################################################################################
        ################################################################################################################
        plt.legend(title=self.Barchart_legend_title, loc='center left', bbox_to_anchor=(1.02, 0.5), facecolor='None',
                   edgecolor='#000000', frameon=True, ncol=1, handlelength=0.9, handleheight=0.9, borderaxespad=0,
                   fontsize='small')
        ################################################################################################################
        ################################################################################################################
        self.fig.tight_layout()
        ############################################
        ############################################
        plt.savefig(self.local_path + self.picture_name + '.jpg', facecolor=self.fig.get_facecolor())
        plt.clf()
        plt.close(self.fig)
13、编写一个sheet名为Arg的绘图的子类
代码如下:
class BarchartByGroupArg(BarchartFather):
    def __init__(self, Barchart_byGroup_xlabels, Barchart_byGroup_data, Barchart_byGroup_legend, title_name,
                 picture_name, number, Barchart_byGroup_ylabels, Barchart_legend_title, legend_label_Arg):
        super().__init__(Barchart_byGroup_xlabels, Barchart_byGroup_data, Barchart_byGroup_legend, title_name,
                         picture_name, number, Barchart_byGroup_ylabels)
        self.Barchart_legend_title = Barchart_legend_title
        self.legend_label_Arg = legend_label_Arg
        self.ylabels = ['0%', '10%', '20%', '30%', '40%', '50%', '60%', '70%', '80%', '90%', '100%']
        self.y_locs = np.arange(0, 110, 10)

    def Bar_ByGroupArg(self):
        iterate_list = []
        # print('$$$list(self.Barchart_byGroup_legend.keys()):', list(self.Barchart_byGroup_legend.keys()))
        for i_key in list(self.Barchart_byGroup_legend.keys()):
            for j_value in list(self.Barchart_byGroup_legend[i_key]):
                iterate_list.append(j_value)
        # print('$$$iterate_list:', iterate_list)
        # print('$$$self.number:', self.number)
        for i, color_idx in zip(range(self.number), iterate_list):
            Barchart_byGroup_data_tmp = self.Barchart_byGroup_data.iloc[i, :].tolist()
            data_format_exchange(Barchart_byGroup_data_tmp)
            # print('$$$len(self.x_list[i]):', len(self.x_list[i]))
            # print('$$$len(Barchart_byGroup_data_tmp):', len(Barchart_byGroup_data_tmp))
            #############################################################################
            # 判断用data_format_exchange函数转化之前的对象是否为字符串:1表示是, 0表示否
            each_Bbdt_flag = 0
            for each_Bbdt in Barchart_byGroup_data_tmp:
                if each_Bbdt > 1:
                    each_Bbdt_flag = 1
                    break
            if each_Bbdt_flag == 0:
                Barchart_byGroup_data_tmp1 = []
                for each_Bbdt in Barchart_byGroup_data_tmp:
                    each_Bbdt = each_Bbdt * 100
                    Barchart_byGroup_data_tmp1.append(each_Bbdt)
                Barchart_byGroup_data_tmp = Barchart_byGroup_data_tmp1
            #############################################################################
            self.ax.bar(self.x_list[i], Barchart_byGroup_data_tmp, color=self.color_list[color_idx], width=self.width,
                        label=self.legend_label_Arg[i])
        self.ax.grid(True, ls=':', color='b', alpha=0.3)
        plt.title(self.title_name, fontweight='bold')
        self.ax.set_xticks(self.x_locs)
        self.ax.set_yticks(self.y_locs)
        self.ax.set_xticklabels(self.Barchart_byGroup_xlabels, rotation=90)
        self.ax.set_yticklabels(self.ylabels)
        self.ax.set_ylabel(self.Barchart_byGroup_ylabels, fontweight='bold')
        ################################################################################################################
        ################################################################################################################
        plt.legend(title=self.Barchart_legend_title, loc='center left', bbox_to_anchor=(1.02, 0.5), facecolor='None',
                   edgecolor='#000000', frameon=True, ncol=1, handlelength=0.9, handleheight=0.9, borderaxespad=0,
                   handletextpad=0.1, fontsize='small')
        ################################################################################################################
        ################################################################################################################
        self.fig.tight_layout()
        ###################################
        ###################################
        plt.savefig(self.local_path + self.picture_name + '.jpg', facecolor=self.fig.get_facecolor())
        plt.clf()
        plt.close(self.fig)

    def Box_ByGroupArg(self):
        for i in range(self.number):
            #####################################################################
            # 先画boxplot
            #######################
            # boxplot_data_num用来统计每组数据的长度, 画scatter图时会用到
            boxplot_data_num = []
            #######################
            boxplot_data = []
            for j_key in list(self.Barchart_byGroup_data):
                boxplot_data_tmp = self.Barchart_byGroup_data[j_key][i]
                boxplot_data.append(boxplot_data_tmp)
                boxplot_data_num_tmp = len(self.Barchart_byGroup_data[j_key][i])
                boxplot_data_num.append(boxplot_data_num_tmp)
            self.ax.boxplot(boxplot_data, positions=self.x_list_box[i], widths=self.box_width,
                            patch_artist=True, medianprops={'lw': 1, 'color': self.color_list[i]},
                            boxprops={'facecolor': 'None', 'edgecolor': self.color_list[i]},
                            capprops={'lw': 1, 'color': self.color_list[i]},
                            whiskerprops={'ls': '-', 'lw': 1, 'color': self.color_list[i]},
                            showfliers=False,
                            zorder=1)
            #####################################################################
            # flierprops={'marker': 's', 'markerfacecolor': self.color_list[i], 'markeredgecolor': self.color_list[i], 'markersize': 3},
            # 再画scatter
            # 将每一组箱线图统计的所有点绘制在图上
            # spotx是每一组箱线图所有的点的横坐标
            spotx = []
            for j_spotx, k_spotx in zip(self.x_list_box[i], boxplot_data_num):
                spotx_tmp = [j_spotx] * k_spotx
                spotx.append(spotx_tmp)
            label_Arg_Boxchart = list(self.Barchart_byGroup_legend)[i]
            if label_Arg_Boxchart == 'None':
                label_Arg_Boxchart = ' '
            self.ax.scatter(spotx, boxplot_data, c=self.color_list[i], s=3,
                            label=label_Arg_Boxchart,
                            zorder=2)
            #####################################################################
        self.ax.grid(True, ls=':', color='b', alpha=0.3)
        plt.title(self.title_name, fontweight='bold')
        self.ax.set_xticks(self.x_locs)
        self.ax.set_yticks(self.y_locs)
        self.ax.set_xticklabels(self.Barchart_byGroup_xlabels, rotation=90)
        self.ax.set_yticklabels(self.ylabels)
        self.ax.set_ylabel(self.Barchart_byGroup_ylabels, fontweight='bold')
        ################################################################################################################
        ################################################################################################################
        plt.legend(title=self.Barchart_legend_title, loc='center left', bbox_to_anchor=(1.02, 0.5), facecolor='None',
                   edgecolor='#000000', frameon=True, ncol=1, markerscale=3, borderaxespad=0, handletextpad=0.1,
                   fontsize='small')
        ################################################################################################################
        ################################################################################################################
        self.fig.tight_layout()
        ##################################
        ##################################
        plt.savefig(self.local_path + self.picture_name + '.jpg', facecolor=self.fig.get_facecolor())
        plt.clf()
        plt.close(self.fig)
14、编写一个sheet名为Argc的绘图的子类
代码如下:
class BarchartByGroupArgc(BarchartFather):
    def __init__(self, Barchart_byGroup_xlabels, Barchart_byGroup_data, Barchart_byGroup_legend, title_name,
                 picture_name, number, Barchart_byGroup_ylabels, Barchart_legend_title, legend_label_Argc):
        super().__init__(Barchart_byGroup_xlabels, Barchart_byGroup_data, Barchart_byGroup_legend, title_name,
                         picture_name, number, Barchart_byGroup_ylabels)
        self.Barchart_legend_title = Barchart_legend_title
        self.legend_label_Argc = legend_label_Argc

    def Bar_ByGroupArgc(self):
        iterate_list = []
        for i_key in list(self.Barchart_byGroup_legend.keys()):
            for j_value in list(self.Barchart_byGroup_legend[i_key]):
                iterate_list.append(j_value)

        for i, color_idx in zip(range(self.number), iterate_list):
            Barchart_byGroup_data_tmp = self.Barchart_byGroup_data.iloc[i, :].tolist()
            data_format_exchange(Barchart_byGroup_data_tmp)
            self.ax.bar(self.x_list[i], Barchart_byGroup_data_tmp, color=self.color_list[color_idx], width=self.width,
                        label=self.legend_label_Argc[i])
        self.ax.grid(True, ls=':', color='b', alpha=0.3)
        plt.title(self.title_name, fontweight='bold')
        self.ax.set_xticks(self.x_locs)
        self.ax.set_xticklabels(self.Barchart_byGroup_xlabels, rotation=90)
        self.ax.set_ylabel(self.Barchart_byGroup_ylabels, fontweight='bold')
        ################################################################################################################
        ################################################################################################################
        plt.legend(title=self.Barchart_legend_title, loc='center left', bbox_to_anchor=(1.02, 0.5), facecolor='None',
                   edgecolor='#000000', frameon=True, ncol=1, handlelength=0.9, handleheight=0.9, borderaxespad=0,
                   handletextpad=0.1, fontsize='small')
        ################################################################################################################
        ################################################################################################################
        self.fig.tight_layout()
        ##################################
        ##################################
        plt.savefig(self.local_path + self.picture_name + '.jpg', facecolor=self.fig.get_facecolor())
        plt.clf()
        plt.close(self.fig)

    def Box_ByGroupArgc(self):
        for i in range(self.number):
            #####################################################################
            # 先画boxplot
            #######################
            # boxplot_data_num用来统计每组数据的长度, 画scatter图时会用到
            boxplot_data_num = []
            #######################
            boxplot_data = []
            for j_key in list(self.Barchart_byGroup_data):
                boxplot_data_tmp = self.Barchart_byGroup_data[j_key][i]
                boxplot_data.append(boxplot_data_tmp)
                boxplot_data_num_tmp = len(self.Barchart_byGroup_data[j_key][i])
                boxplot_data_num.append(boxplot_data_num_tmp)
            self.ax.boxplot(boxplot_data, positions=self.x_list_box[i], widths=self.box_width,
                            patch_artist=True, medianprops={'lw': 1, 'color': self.color_list[i]},
                            boxprops={'facecolor': 'None', 'edgecolor': self.color_list[i]},
                            capprops={'lw': 1, 'color': self.color_list[i]},
                            whiskerprops={'ls': '-', 'lw': 1, 'color': self.color_list[i]},
                            showfliers=False,
                            zorder=1)
            #####################################################################
            # flierprops={'marker': 's', 'markerfacecolor': self.color_list[i], 'markeredgecolor': self.color_list[i], 'markersize': 3},
            # 再画scatter
            # 将每一组箱线图统计的所有点绘制在图上
            # spotx是每一组箱线图所有的点的横坐标
            spotx = []
            for j_spotx, k_spotx in zip(self.x_list_box[i], boxplot_data_num):
                spotx_tmp = [j_spotx] * k_spotx
                spotx.append(spotx_tmp)
            label_Argc_Boxchart = list(self.Barchart_byGroup_legend)[i]
            if label_Argc_Boxchart == 'None':
                label_Argc_Boxchart = ' '
            self.ax.scatter(spotx, boxplot_data, c=self.color_list[i], s=3,
                            label=label_Argc_Boxchart,
                            zorder=2)
            #####################################################################
        self.ax.grid(True, ls=':', color='b', alpha=0.3)
        plt.title(self.title_name, fontweight='bold')
        self.ax.set_xticks(self.x_locs)
        self.ax.set_xticklabels(self.Barchart_byGroup_xlabels, rotation=90)
        self.ax.set_ylabel(self.Barchart_byGroup_ylabels, fontweight='bold')
        ################################################################################################################
        ################################################################################################################
        plt.legend(title=self.Barchart_legend_title, loc='center left', bbox_to_anchor=(1.02, 0.5), facecolor='None',
                   edgecolor='#000000', frameon=True, ncol=1, markerscale=3, borderaxespad=0, handletextpad=0.1,
                   fontsize='small')
        ################################################################################################################
        ################################################################################################################
        self.fig.tight_layout()
        ##################################
        ##################################
        plt.savefig(self.local_path + self.picture_name + '.jpg', facecolor=self.fig.get_facecolor())
        plt.clf()
        plt.close(self.fig)
15、脚本主体
代码如下:
if __name__ == '__main__':
df_Input_dict = get_Input_data(file_lists_Input)
Input_flag = list(df_Input_dict)
print('$$$Input_flag:', Input_flag)
df_Split = get_split_data(file_lists_split)
Type_ID = df_Split[list(df_Split)[0]].tolist()[0]
Nowtime = dt.datetime.now().strftime('%Y-%m-%d-%H_%M_%S')
os.makedirs(path_pardir + '/output/' + str(Type_ID) + '_' + Nowtime)
dict_Config = get_config_data(file_lists_config)
# print(df_Split)
print('#' * 50)
# 获取df_Split的列标签
df_Split_cols = list(df_Split)
# print('$$$df_Split_cols:', df_Split_cols)
# 获取df_Split的列标签中属于split类型的标签, 即去除前两列的Type和Box这两个列标签
cols_Split_items = df_Split_cols[2:]
# print('$$$cols_Split_items:', cols_Split_items)
for input_flag in Input_flag:
################################################################################################################
# Gar
################################################################################################################
if input_flag == 'Gar':
print('正在处理Gar有关数据并作图, 请稍等...')
df_Gar = df_Input_dict['Gar']
df_Gar = df_Gar.dropna(axis=0, how='all')
# print('$$$df_Gar:', df_Gar.head())
# print('$$$df_Gar.Type:', df_Gar.Type)
# print('$$$df_Gar的列标签', list(df_Gar))
#############################################
df_Split_copy = df_Split.copy()
df_Split_copy = df_Split_copy.fillna('None')
#############################################
Config_Gar = dict_Config['Sort_Gar']
#############################################
for cols_Split_item in cols_Split_items:
###################################################################################
index_list_Gar = df_Split_copy[cols_Split_item].tolist()
index_dict_Gar = {}
byGroup_list_Gar = []
###################################################################################
df_Gar.insert(2, cols_Split_item, df_Split_copy.pop(cols_Split_item))
###################################################################################
# print('$$$df_Gar:', df_Gar)
# df.groupby()返回的是一个对象类型(object), 不是DataFrame类型
###################################################################################
df_Gar_byGroup = df_Gar.groupby(cols_Split_item, as_index=False)
###################################################################################
# print('$$$df_Gar_byGroup:', df_Gar_byGroup)
###################################################################################
result_Gar = zip(*df_Gar_byGroup)
n, g = [list(i) for i in result_Gar]
###################################################################################
for name, group in df_Gar_byGroup:
# print('$$$name:', name)
# print(group)
index_dict_Gar[name] = index_list_Gar.index(name)
# print('$$$index_dict_Gar:', index_dict_Gar)
###################################################################################
v = list(index_dict_Gar.values())
# print('$$$v:', v)
df_Gar_byGroup_zipped = zip(n, g, v)
df_Gar_byGroup_sorted = sorted(df_Gar_byGroup_zipped, key=lambda x: x[2])
###################################################################################
for name, group, value in df_Gar_byGroup_sorted:
# 对df.groupby()返回的对象使用get_group()方法, 从而得到每个group对应的DataFrame类型
# get_group()方法一次只能得到其中一个group, 如果有多个group需要多次调用get_group()
df_Gar_byGroup_temp = df_Gar_byGroup.get_group(name)
byGroup_list_Gar.append(df_Gar_byGroup_temp)
# 用pd.concat()方法把多个DataFrame拼接成一个
df_Gar_Grouped = pd.concat(byGroup_list_Gar)
# print('$$$df_Gar_Grouped:', df_Gar_Grouped)
###################################################################################
df_Gar.pop(cols_Split_item)
# print('$$$df_Gar_pop:', df_Gar)
###################################################################################
# 准备好xlabel
Split_list_Gar = df_Gar_Grouped[cols_Split_item].tolist()
# print('$$$Split_list_Gar:', Split_list_Gar)
xlabel_Gar = []
for Split_item, Split_item_index in zip(Split_list_Gar, range(len(Split_list_Gar))):
if Split_list_Gar[Split_item_index] == 'None':
Split_item = ''
Type_ID_Gar = df_Gar_Grouped[list(df_Gar_Grouped)[0]].tolist()[Split_item_index]
Box_ID_Gar = df_Gar_Grouped[list(df_Gar_Grouped)[1]].tolist()[Split_item_index]
if len(str(Box_ID_Gar)) == 1:
xlabel_Gar_tmp = Split_item + '::' + str(Type_ID_Gar) + '::B0' + str(Box_ID_Gar)
# xlabel_Gar_tmp = Split_item + '::B0' + str(Box_ID_Gar)
xlabel_Gar.append(xlabel_Gar_tmp)
else:
xlabel_Gar_tmp = Split_item + '::' + str(Type_ID_Gar) + '::B' + str(Box_ID_Gar)
# xlabel_Gar_tmp = Split_item + '::B' + str(Box_ID_Gar)
xlabel_Gar.append(xlabel_Gar_tmp)
# print('$$$xlabel_Gar:', xlabel_Gar)
########################################################################################################
# 根据Config判断画哪种图
# print('$$$Config_Gar:', Config_Gar)
############################################################
for Config_Gar_key in list(Config_Gar.keys()):
########################################################
# 画Barchart_byGroup类型
if Config_Gar_key == 'Barchart_byGroup_Item':
Barchart_byGroup_Data = {}
Barchart_byGroup_Legend = {}
for Config_Gar_value in Config_Gar[Config_Gar_key]:
if re.match(r'A.*[LMS].*[el].4kg', Config_Gar_value, re.I):
Apple_LMSe_4kg = re.match(r'A.*[LMS].*[el].4kg', Config_Gar_value, re.I)
Barchart_byGroup_Data.setdefault('Apple_L_M_S_4kg', []).append(df_Gar_Grouped[Config_Gar_value].tolist())
Barchart_byGroup_Legend.setdefault('Apple_L_M_S_4kg', []).append(Apple_LMSe_4kg.group())
elif re.match(r'A.*[LMS].*[el].8kg', Config_Gar_value, re.I):
Apple_LMSe_8kg = re.match(r'A.*[LMS].*[el].8kg', Config_Gar_value, re.I)
Barchart_byGroup_Data.setdefault('Apple_L_M_S_8kg', []).append(df_Gar_Grouped[Config_Gar_value].tolist())
Barchart_byGroup_Legend.setdefault('Apple_L_M_S_8kg', []).append(Apple_LMSe_8kg.group())
elif re.match(r'A.*[LMS].*[el].16kg', Config_Gar_value, re.I):
Apple_LMSe_16kg = re.match(r'A.*[LMS].*[el].16kg', Config_Gar_value, re.I)
Barchart_byGroup_Data.setdefault('Apple_L_M_S_16kg', []).append(df_Gar_Grouped[Config_Gar_value].tolist())
Barchart_byGroup_Legend.setdefault('Apple_L_M_S_16kg', []).append(Apple_LMSe_16kg.group())
# print('$$$Barchart_byGroup_Data:', Barchart_byGroup_Data)
# print('$$$Barchart_byGroup_Legend:', Barchart_byGroup_Legend)
########################################################################################################################
# Draw Map information
title_Gar = ' L/M/S Gar Trend order by ' + cols_Split_item
for key in list(Barchart_byGroup_Data):
cols_Split_item_correct = cols_Split_item.replace('/', ' ')
picture_Gar = cols_Split_item_correct + ' ' + key
length_Gar = len(Barchart_byGroup_Data[key])
Barchart_byGroup_Gar = BarchartByGroupGar(xlabel_Gar, Barchart_byGroup_Data[key], Barchart_byGroup_Legend[key], title_Gar, picture_Gar, length_Gar, key)
Barchart_byGroup_Gar.Bar_ByGroupGar()
# break
print('Gar有关数据处理并作图完毕!')
################################################################################################################
# Ban
################################################################################################################
elif input_flag == 'Ban':
print('正在处理Ban有关数据并作图, 请稍等...')
df_Ban = df_Input_dict['Ban']
df_Ban = df_Ban.dropna(axis=0, how='all')
# print('$$$df_Ban:', df_Ban.head())
# print('$$$df_Ban.Type:', df_Ban.Type)
# print('$$$df_Ban的列标签:', list(df_Ban))
#############################################################################
df_Split_copy = df_Split.copy()
df_Split_copy = df_Split_copy.fillna('None')
###############################################
Config_Ban = dict_Config['Sort_Ban']
###############################################
for cols_Split_item in cols_Split_items:
#########################################################################
index_list_Ban = df_Split_copy[cols_Split_item].tolist()
index_dict_Ban = {}
byGroup_list_Ban = []
#########################################################################
df_Ban.insert(2, cols_Split_item, df_Split_copy.pop(cols_Split_item))
#########################################################################
# print('$$$df_Ban:', df_Ban)
# df.groupby()返回的是一个对象类型(object), 不是DataFrame类型
#########################################################################
df_Ban_byGroup = df_Ban.groupby(cols_Split_item, as_index=False)
#########################################################################
# print('$$$df_Ban_byGroup:', df_Ban_byGroup)
#########################################################################
result_Ban = zip(*df_Ban_byGroup)
n, g = [list(i) for i in result_Ban]
#########################################################################
for name, group in df_Ban_byGroup:
# print('$$$name:', name)
# print(group)
index_dict_Ban[name] = index_list_Ban.index(name)
# print('$$$index_dict_Ban:', index_dict_Ban)
#########################################################################
v = list(index_dict_Ban.values())
# print('$$$v:', v)
df_Ban_byGroup_zipped = zip(n, g, v)
df_Ban_byGroup_sorted = sorted(df_Ban_byGroup_zipped, key=lambda x: x[2])
#########################################################################
for name, group, value in df_Ban_byGroup_sorted:
df_Ban_byGroup_temp = df_Ban_byGroup.get_group(name)
byGroup_list_Ban.append(df_Ban_byGroup_temp)
# 用pd.concat()方法把多个DataFrame拼接成一个
df_Ban_Grouped = pd.concat(byGroup_list_Ban)
# print('$$$df_Ban_Grouped:', df_Ban_Grouped)
#########################################################################
df_Ban.pop(cols_Split_item)
# print('$$$df_Ban_pop:', df_Ban)
#########################################################################
# 准备好xlabel
Split_list_Ban = df_Ban_Grouped[cols_Split_item].tolist()
# print('$$$Split_list_Ban:', Split_list_Ban)
xlabel_Ban = []
for Split_item, Split_item_index in zip(Split_list_Ban, range(len(Split_list_Ban))):
if Split_list_Ban[Split_item_index] == 'None':
Split_item = ''
Type_ID_Ban = df_Ban_Grouped[list(df_Ban_Grouped)[0]].tolist()[Split_item_index]
Box_ID_Ban = df_Ban_Grouped[list(df_Ban_Grouped)[1]].tolist()[Split_item_index]
if len(str(Box_ID_Ban)) == 1:
xlabel_Ban_tmp = Split_item + '::' + str(Type_ID_Ban) + '::B0' + str(Box_ID_Ban)
xlabel_Ban.append(xlabel_Ban_tmp)
else:
xlabel_Ban_tmp = Split_item + '::' + str(Type_ID_Ban) + '::B' + str(Box_ID_Ban)
xlabel_Ban.append(xlabel_Ban_tmp)
# print('$$$xlabel_Ban:', xlabel_Ban)
#########################################################################
# 根据Config判断画哪种图
# print('$$$Config_Ban:', Config_Ban)
#########################################################################
for Config_Ban_key in list(Config_Ban.keys()):
#####################################################################
# 画Barchart_byGroup类型
if Config_Ban_key == 'Barchart_byGroup_Item':
Barchart_byGroup_Data = {}
Barchart_byGroup_Legend = {}
for Config_Ban_value in Config_Ban[Config_Ban_key]:
if re.match(r'A.*[LMS].*[el].4kg', Config_Ban_value, re.I):
Apple_LMSe_4kg = re.match(r'A.*[LMS].*[el].4kg', Config_Ban_value, re.I)
Barchart_byGroup_Data.setdefault('Apple_L_M_S_4kg_Ban', []).append(df_Ban_Grouped[Config_Ban_value].tolist())
Barchart_byGroup_Legend.setdefault('Apple_L_M_S_4kg_Ban', []).append(Apple_LMSe_4kg.group())
elif re.match(r'A.*[LMS].*[el].8kg', Config_Ban_value, re.I):
Apple_LMSe_8kg = re.match(r'A.*[LMS].*[el].8kg', Config_Ban_value, re.I)
Barchart_byGroup_Data.setdefault('Apple_L_M_S_8kg_Ban', []).append(df_Ban_Grouped[Config_Ban_value].tolist())
Barchart_byGroup_Legend.setdefault('Apple_L_M_S_8kg_Ban', []).append(Apple_LMSe_8kg.group())
elif re.match(r'A.*[LMS].*[el].16kg', Config_Ban_value, re.I):
Apple_LMSe_16kg = re.match(r'A.*[LMS].*[el].16kg', Config_Ban_value, re.I)
Barchart_byGroup_Data.setdefault('Apple_L_M_S_16kg_Ban', []).append(df_Ban_Grouped[Config_Ban_value].tolist())
Barchart_byGroup_Legend.setdefault('Apple_L_M_S_16kg_Ban', []).append(Apple_LMSe_16kg.group())
# print('$$$Barchart_byGroup_Data:', Barchart_byGroup_Data)
# print('$$$Barchart_byGroup_Legend:', Barchart_byGroup_Legend)
################################################################################################
# Draw Map information
title_Ban = ' L/M/S Ban Trend order by ' + cols_Split_item
for key in list(Barchart_byGroup_Data):
cols_Split_item_correct = cols_Split_item.replace('/', ' ')
picture_Ban = cols_Split_item_correct + ' ' + key
length_Ban = len(Barchart_byGroup_Data[key])
Barchart_byGroup_Ban = BarchartByGroupBan(xlabel_Ban, Barchart_byGroup_Data[key], Barchart_byGroup_Legend[key], title_Ban, picture_Ban, length_Ban, key)
Barchart_byGroup_Ban.Bar_ByGroupBan()
# break
print('Ban有关数据处理并作图完毕!')
################################################################################################################
# Para
################################################################################################################
elif input_flag == 'Para':
print('正在处理Para有关数据并作图, 请稍等...')
df_Para = df_Input_dict['Para']
df_Para = df_Para.dropna(axis=0, how='all')
# print('$$$df_Para:', df_Para.head())
# print('$$$df_Para.Type:', df_Para.Type)
# print('$$$df_Para的列标签:', list(df_Para))
########################################################
df_Split_copy = df_Split.copy()
df_Split_copy = df_Split_copy.fillna('None')
########################################################
Config_Para = dict_Config['Sort_Para']
########################################################
for cols_Split_item in cols_Split_items:
###############################################################################
index_list_Para = df_Split_copy[cols_Split_item].tolist()
index_dict_Para = {}
byGroup_list_Para = []
###############################################################################
df_Para.insert(2, cols_Split_item, df_Split_copy.pop(cols_Split_item))
###############################################################################
# print('$$$df_Para:', df_Para)
# df.groupby()返回的是一个对象类型(object), 不是DataFrame类型
###############################################################################
df_Para_byGroup = df_Para.groupby(cols_Split_item, as_index=False)
###############################################################################
# print('$$$df_Para_byGroup:', df_Para_byGroup)
###############################################################################
result_Para = zip(*df_Para_byGroup)
n, g = [list(i) for i in result_Para]
###############################################################################
for name, group in df_Para_byGroup:
# print('$$$name:', name)
# print('$$$group:', group)
index_dict_Para[name] = index_list_Para.index(name)
# print('$$$index_dict_Para:', index_dict_Para)
###############################################################################
v = list(index_dict_Para.values())
# print('$$$v:', v)
df_Para_byGroup_zipped = zip(n, g, v)
df_Para_byGroup_sorted = sorted(df_Para_byGroup_zipped, key=lambda x: x[2])
###############################################################################
for name, group, value in df_Para_byGroup_sorted:
df_Para_byGroup_temp = df_Para_byGroup.get_group(name)
byGroup_list_Para.append(df_Para_byGroup_temp)
# 用pd.concat()方法把多个DataFrame拼接成一个
df_Para_Grouped = pd.concat(byGroup_list_Para)
# print('$$$df_Para_Grouped:', df_Para_Grouped)
###############################################################################
df_Para.pop(cols_Split_item)
# print('$$$df_Para_pop:', df_Para)
###############################################################################
# 准备好xlabel
Split_list_Para = df_Para_Grouped[cols_Split_item].tolist()
# print('$$$Split_list_Para:', Split_list_Para)
xlabel_Para = []
for Split_item, Split_item_index in zip(Split_list_Para, range(len(Split_list_Para))):
if Split_list_Para[Split_item_index] == 'None':
Split_item = ''
Type_ID_Para = df_Para_Grouped[list(df_Para_Grouped)[0]].tolist()[Split_item_index]
Box_ID_Para = df_Para_Grouped[list(df_Para_Grouped)[1]].tolist()[Split_item_index]
if len(str(Box_ID_Para)) == 1:
xlabel_Para_tmp = Split_item + '::' + str(Type_ID_Para) + '::B0' + str(Box_ID_Para)
xlabel_Para.append(xlabel_Para_tmp)
else:
xlabel_Para_tmp = Split_item + '::' + str(Type_ID_Para) + '::B' + str(Box_ID_Para)
xlabel_Para.append(xlabel_Para_tmp)
# print('$$$xlabel_Para:', xlabel_Para)
###############################################################################
# 准备好ylabel
ylabel_Para = 'Median'
###############################################################################
# 准备好图例的标题Legend_title和图例Legend
Barchart_Legend_title = cols_Split_item
# print('$$$$$$---This Barchart_Legend_title is in the part of Para---$$$$$$:')
# print('$$$Barchart_Legend_title:', Barchart_Legend_title)
####################
Barchart_Legend = []
####################
for i in df_Para_Grouped[Barchart_Legend_title].tolist():
if i not in Barchart_Legend:
Barchart_Legend.append(i)
# print('$$$Barchart_Legend:', Barchart_Legend)
###############################################################################
# 根据Config判断画哪种图
# print('$$$Config_Para:', Config_Para)
###############################################################################
for Config_Para_key in list(Config_Para.keys()):
###########################################################################
# 画Barchart类型(not byGroup)
if Config_Para_key == 'Barchart_Item':
##################
Barchart_Data = {}
##################
##########################################################
# 按Split对Barchart_Data进行分组, 注意与上面的Barchart_byGroup_Data的分组规则不同
for Config_Para_value in Config_Para[Config_Para_key]:
Barchart_Data.setdefault(Config_Para_value, {})
for i in Barchart_Legend:
index_Para = df_Para_Grouped[df_Para_Grouped[cols_Split_item] == i].index.tolist()
# print('$$$index_Para:', index_Para)
for j in index_Para:
Barchart_Data[Config_Para_value].setdefault(i, []).append(df_Para_Grouped[Config_Para_value][j])
##########################################################
# print('$$$Barchart_Data:', Barchart_Data)
################################################################################################
# Draw Map information
for key in list(Barchart_Data):
title_Para = ' Parameter=' + key + '\n' + key + ' Trend'
cols_Split_item_correct = cols_Split_item.replace('/', ' ')
picture_Para = cols_Split_item_correct + ' ' + key
length_Para = 1
Barchart_byGroup_Para = BarchartSinglePara(xlabel_Para, Barchart_Data[key], Barchart_Legend, title_Para, picture_Para, length_Para, ylabel_Para, Barchart_Legend_title)
Barchart_byGroup_Para.Bar_Para()
# break
print('Para有关数据处理并作图完毕!')
################################################################################################################
# Arg
################################################################################################################
elif input_flag == 'Arg':
print('正在处理Arg有关数据并作图, 请稍等...')
df_Arg = df_Input_dict['Arg']
df_Arg = df_Arg.dropna(axis=0, how='all')
# print('$$$df_Arg:', df_Arg.head())
# print('$$$df_Arg.Type:', df_Arg.Type)
# print('$$$df_Arg的列标签:', list(df_Arg))
########################################################
df_Split_copy = df_Split.copy()
df_Split_copy = df_Split_copy.fillna('None')
########################################################
Config_Arg = dict_Config['Sort_Arg']
########################################################
for cols_Split_item in cols_Split_items:
###############################################################################
index_list_Arg = df_Split_copy[cols_Split_item].tolist()
index_dict_Arg = {}
byGroup_list_Arg = []
###############################################################################
df_Arg.insert(2, cols_Split_item, df_Split_copy.pop(cols_Split_item))
###############################################################################
# print('$$$df_Arg:', df_Arg)
# df.groupby()返回的是一个对象类型(object), 不是DataFrame类型
###############################################################################
df_Arg_byGroup = df_Arg.groupby(cols_Split_item, as_index=False)
###############################################################################
# print('$$$df_Arg_byGroup:', df_Arg_byGroup)
###############################################################################
result_Arg = zip(*df_Arg_byGroup)
n, g = [list(i) for i in result_Arg]
###############################################################################
for name, group in df_Arg_byGroup:
# print('$$$name:', name)
# print(group)
index_dict_Arg[name] = index_list_Arg.index(name)
# print('$$$index_dict_Arg:', index_dict_Arg)
###############################################################################
v = list(index_dict_Arg.values())
# print('$$$v:', v)
df_Arg_byGroup_zipped = zip(n, g, v)
df_Arg_byGroup_sorted = sorted(df_Arg_byGroup_zipped, key=lambda x: x[2])
###############################################################################
for name, group, value in df_Arg_byGroup_sorted:
df_Arg_byGroup_temp = df_Arg_byGroup.get_group(name)
byGroup_list_Arg.append(df_Arg_byGroup_temp)
# 用pd.concat()方法把多个DataFrame拼接成一个
df_Arg_Grouped = pd.concat(byGroup_list_Arg)
# print('$$$df_Arg_Grouped:', df_Arg_Grouped)
###############################################################################
df_Arg.pop(cols_Split_item)
# print('$$$df_Arg_pop:', df_Arg)
###############################################################################
# 准备好legend_label
Split_list_Arg = df_Arg_Grouped[cols_Split_item].tolist()
# print('$$$Split_list_Arg:', Split_list_Arg)
Legend_label_Arg = []
for Split_item, Split_item_index in zip(Split_list_Arg, range(len(Split_list_Arg))):
if Split_list_Arg[Split_item_index] == 'None':
Split_item = ''
Type_ID_Arg = df_Arg_Grouped[list(df_Arg_Grouped)[0]].tolist()[Split_item_index]
Box_ID_Arg = df_Arg_Grouped[list(df_Arg_Grouped)[1]].tolist()[Split_item_index]
if len(str(Box_ID_Arg)) == 1:
Legend_label_Arg_tmp = Split_item + '::' + str(Type_ID_Arg) + '::B0' + str(Box_ID_Arg)
Legend_label_Arg.append(Legend_label_Arg_tmp)
else:
Legend_label_Arg_tmp = Split_item + '::' + str(Type_ID_Arg) + '::B' + str(Box_ID_Arg)
Legend_label_Arg.append(Legend_label_Arg_tmp)
# print('$$$Legend_label_Arg:', Legend_label_Arg)
###############################################################################
# 准备好xlabel
xlabel_Arg = list(df_Arg_Grouped)[3:]
###############################################################################
# 准备好ylabel
ylabel_Arg = 'Arg Ratio'
###############################################################################
# 准备好图例的标题Legend_title和图例Legend
Barchart_Legend_title = cols_Split_item
# print('$$$$$$---This Barchart_Legend_title is in the part of Arg---$$$$$$')
# print('$$$Barchart_Legend_title:', Barchart_Legend_title)
###############################################################################
# 字典Barchart_Legend的键为cols_Split_item的每一种group的名字
# 字典Barchart_Legend的值为每一种group对应的索引, 相同的group索引相同,
# 索引从0开始计, 每遇到一种不同的group, 索引值加1, 否则索引值不变
# Barchart_Legend_tmp为一个临时列表, 用完就丢弃
Barchart_Legend = {}
Barchart_Legend_tmp = []
###############################################################################
cols_Split_item_groups = df_Arg_Grouped[Barchart_Legend_title].tolist()
# print('$$$cols_Split_item_groups:', cols_Split_item_groups)
for i in cols_Split_item_groups:
if i not in Barchart_Legend_tmp:
Barchart_Legend_tmp.append(i)
for i in cols_Split_item_groups:
Barchart_Legend.setdefault(i, []).append(Barchart_Legend_tmp.index(i))
# print('$$$Barchart_Legend:', Barchart_Legend)
###############################################################################
###############################################################################
sum_groupsNums = 0
Barchart_Legend_groupsNums = []
for i in Barchart_Legend:
sum_groupsNums += cols_Split_item_groups.count(i)
Barchart_Legend_groupsNums.append(sum_groupsNums)
# print('$$$Barchart_Legend_groupsNums:', Barchart_Legend_groupsNums)
###############################################################################
###############################################################################
###############################################################################
# 根据Config判断画哪种图
# print('$$$Config_Arg:', Config_Arg)
##################################################
for Config_Arg_key in list(Config_Arg.keys()):
##############################################
# 画Barchart_byGroup类型
if Config_Arg_key == 'Barchart_byGroup_Item':
########################################
# 去掉df_Arg_Grouped的前三列(Type, Box, cols_Split_item)
Barchart_byGroup_Data = df_Arg_Grouped.drop(columns=list(df_Arg_Grouped)[0:3], inplace=False)
########################################
# print('$$$Barchart_byGroup_Data:', Barchart_byGroup_Data)
#############################
# Draw Map information
title_Arg = ' Arg Ratio by ' + cols_Split_item
cols_Split_item_correct = cols_Split_item.replace('/', ' ')
picture_Arg = cols_Split_item_correct + ' Arg Barchart'
# 计算Barchart_byGroup_Data每个column的长度, 即每个group中柱子的个数
# print('$$$list(Barchart_byGroup_Data):', list(Barchart_byGroup_Data))
length_Arg = len(Barchart_byGroup_Data[list(Barchart_byGroup_Data)[0]])
# print('$$$length_Arg:', length_Arg)
Barchart_byGroup_Arg = BarchartByGroupArg(xlabel_Arg, Barchart_byGroup_Data, Barchart_Legend, title_Arg, picture_Arg, length_Arg, ylabel_Arg, Barchart_Legend_title, Legend_label_Arg)
Barchart_byGroup_Arg.Bar_ByGroupArg()
##############################################
# 画Boxchart_byGroup类型
elif Config_Arg_key == 'Boxchart_byGroup_Item':
########################################
Boxchart_byGroup_Data = {}
########################################
# 去掉df_Arg_Grouped的前三列(Type, Box, cols_Split_item)
Boxchart_byGroup_Data_ref = df_Arg_Grouped.drop(columns=list(df_Arg_Grouped)[0:3], inplace=False)
########################################
# print('$$$Boxchart_byGroup_Data_ref:', Boxchart_byGroup_Data_ref)
########################################
for i in list(Boxchart_byGroup_Data_ref):
cut_index_groupsNum = 0
for Barchart_Legend_groupsNum in Barchart_Legend_groupsNums:
if Barchart_Legend_groupsNum == len(cols_Split_item_groups):
Boxchart_byGroup_Data_trans = Boxchart_byGroup_Data_ref[i].tolist()
data_format_exchange(Boxchart_byGroup_Data_trans)
###################################################################
###################################################################
# 判断用data_format_exchange函数转化之前的对象是否为字符串:1表示是, 0表示否
each_Bbdts_flag = 0
for each_Bbdts in Boxchart_byGroup_Data_trans:
if each_Bbdts > 1:
each_Bbdts_flag = 1
break
if each_Bbdts_flag == 0:
Boxchart_byGroup_Data_trans1 = []
for each_Bbdts in Boxchart_byGroup_Data_trans:
each_Bbdts = each_Bbdts * 100
Boxchart_byGroup_Data_trans1.append(each_Bbdts)
Boxchart_byGroup_Data_trans = Boxchart_byGroup_Data_trans1
###################################################################
###################################################################
Boxchart_byGroup_Data.setdefault(i, []).append(Boxchart_byGroup_Data_trans[cut_index_groupsNum:])
else:
Boxchart_byGroup_Data_trans = Boxchart_byGroup_Data_ref[i].tolist()
data_format_exchange(Boxchart_byGroup_Data_trans)
###################################################################
###################################################################
# 判断用data_format_exchange函数转化之前的对象是否为字符串:1表示是, 0表示否
each_Bbdts_flag = 0
for each_Bbdts in Boxchart_byGroup_Data_trans:
if each_Bbdts > 1:
each_Bbdts_flag = 1
break
if each_Bbdts_flag == 0:
Boxchart_byGroup_Data_trans1 = []
for each_Bbdts in Boxchart_byGroup_Data_trans:
each_Bbdts = each_Bbdts * 100
Boxchart_byGroup_Data_trans1.append(each_Bbdts)
Boxchart_byGroup_Data_trans = Boxchart_byGroup_Data_trans1
###################################################################
###################################################################
Boxchart_byGroup_Data.setdefault(i, []).append(Boxchart_byGroup_Data_trans[cut_index_groupsNum:Barchart_Legend_groupsNum])
cut_index_groupsNum = Barchart_Legend_groupsNum
# print('$$$Boxchart_byGroup_Data:', Boxchart_byGroup_Data)
#############################
# Draw Map information
title_Arg = ' Arg Ratio by ' + cols_Split_item
cols_Split_item_correct = cols_Split_item.replace('/', ' ')
picture_Arg = cols_Split_item_correct + ' Arg Boxchart'
# 计算Boxchart中每个group中箱型图的个数
length_Arg = len(Barchart_Legend)
# print('$$$length_Arg:', length_Arg)
Boxchart_byGroup_Arg = BarchartByGroupArg(xlabel_Arg, Boxchart_byGroup_Data, Barchart_Legend, title_Arg, picture_Arg, length_Arg, ylabel_Arg, Barchart_Legend_title, Legend_label_Arg)
Boxchart_byGroup_Arg.Box_ByGroupArg()
# break
print('Arg有关数据处理并作图完毕!')
################################################################################################################
# Argc
################################################################################################################
elif input_flag == 'Argc':
print('正在处理Argc有关数据并作图, 请稍等...')
df_Argc = df_Input_dict['Argc']
df_Argc = df_Argc.dropna(axis=0, how='all')
# print('$$$df_Argc:', df_Argc.head())
# print('$$$df_Argc.Type:', df_Argc.Type)
# print('$$$df_Argc的列标签:', list(df_Argc))
########################################################
df_Split_copy = df_Split.copy()
df_Split_copy = df_Split_copy.fillna('None')
########################################################
Config_Argc = dict_Config['Sort_Argc']
########################################################
for cols_Split_item in cols_Split_items:
###############################################################################
index_list_Argc = df_Split_copy[cols_Split_item].tolist()
index_dict_Argc = {}
byGroup_list_Argc = []
###############################################################################
df_Argc.insert(2, cols_Split_item, df_Split_copy.pop(cols_Split_item))
###############################################################################
# print('$$$df_Argc:', df_Argc)
# df.groupby()返回的是一个对象类型(object), 不是DataFrame类型
###############################################################################
df_Argc_byGroup = df_Argc.groupby(cols_Split_item, as_index=False)
###############################################################################
# print('$$$df_Argc_byGroup:', df_Argc_byGroup)
###############################################################################
result_Argc = zip(*df_Argc_byGroup)
n, g = [list(i) for i in result_Argc]
###############################################################################
for name, group in df_Argc_byGroup:
# print('$$$name:', name)
# print(group)
index_dict_Argc[name] = index_list_Argc.index(name)
# print('$$$index_dict_Argc:', index_dict_Argc)
###############################################################################
v = list(index_dict_Argc.values())
# print('$$$v:', v)
df_Argc_byGroup_zipped = zip(n, g, v)
df_Argc_byGroup_sorted = sorted(df_Argc_byGroup_zipped, key=lambda x: x[2])
###############################################################################
for name, group, value in df_Argc_byGroup_sorted:
df_Argc_byGroup_temp = df_Argc_byGroup.get_group(name)
byGroup_list_Argc.append(df_Argc_byGroup_temp)
# 用pd.concat()方法把多个DataFrame拼接成一个
df_Argc_Grouped = pd.concat(byGroup_list_Argc)
# print('$$$df_Argc_Grouped:', df_Argc_Grouped)
###############################################################################
df_Argc.pop(cols_Split_item)
# print('$$$df_Argc_pop:', df_Argc)
###############################################################################
# 准备好legend_label
Split_list_Argc = df_Argc_Grouped[cols_Split_item].tolist()
# print('$$$Split_list_Argc:', Split_list_Argc)
Legend_label_Argc = []
for Split_item, Split_item_index in zip(Split_list_Argc, range(len(Split_list_Argc))):
if Split_list_Argc[Split_item_index] == 'None':
Split_item = ''
Type_ID_Argc = df_Argc_Grouped[list(df_Argc_Grouped)[0]].tolist()[Split_item_index]
Box_ID_Argc = df_Argc_Grouped[list(df_Argc_Grouped)[1]].tolist()[Split_item_index]
if len(str(Box_ID_Argc)) == 1:
Legend_label_Argc_tmp = Split_item + '::' + str(Type_ID_Argc) + '::B0' + str(Box_ID_Argc)
Legend_label_Argc.append(Legend_label_Argc_tmp)
else:
Legend_label_Argc_tmp = Split_item + '::' + str(Type_ID_Argc) + '::B' + str(Box_ID_Argc)
Legend_label_Argc.append(Legend_label_Argc_tmp)
# print('$$$Legend_label_Argc:', Legend_label_Argc)
###############################################################################
# 准备好xlabel
xlabel_Argc = list(df_Argc_Grouped)[3:]
###############################################################################
# 准备好ylabel
ylabel_Argc = 'Arg Count'
###############################################################################
# 准备好图例的标题Legend_title和图例Legend
Barchart_Legend_title = cols_Split_item
# print('$$$$$$---This Barchart_Legend_title is in the part of Argc---$$$$$$')
# print('$$$Barchart_Legend_title:', Barchart_Legend_title)
###############################################################################
# 字典Barchart_Legend的键为cols_Split_item的每一种group的名字
# 字典Barchart_Legend的值为每一种group对应的索引, 相同的group索引相同,
# 索引从0开始计, 每遇到一种不同的group, 索引值加1, 否则索引值不变
# Barchart_Legend_tmp为一个临时列表, 用完就丢弃
Barchart_Legend = {}
Barchart_Legend_tmp = []
###############################################################################
cols_Split_item_groups = df_Argc_Grouped[Barchart_Legend_title].tolist()
# print('$$$cols_Split_item_groups:', cols_Split_item_groups)
for i in cols_Split_item_groups:
if i not in Barchart_Legend_tmp:
Barchart_Legend_tmp.append(i)
for i in cols_Split_item_groups:
Barchart_Legend.setdefault(i, []).append(Barchart_Legend_tmp.index(i))
# print('$$$Barchart_Legend:', Barchart_Legend)
###############################################################################
###############################################################################
sum_groupsNums = 0
Barchart_Legend_groupsNums = []
for i in Barchart_Legend:
sum_groupsNums += cols_Split_item_groups.count(i)
Barchart_Legend_groupsNums.append(sum_groupsNums)
# print('$$$Barchart_Legend_groupsNums:', Barchart_Legend_groupsNums)
###############################################################################
###############################################################################
###############################################################################
# 根据Config判断画哪种图
# print('$$$Config_Argc:', Config_Argc)
##################################################
for Config_Argc_key in list(Config_Argc.keys()):
##############################################
# 画Barchart_byGroup类型
if Config_Argc_key == 'Barchart_byGroup_Item':
########################################
# 去掉df_Argc_Grouped的前三列(Type, Box, cols_Split_item)
Barchart_byGroup_Data = df_Argc_Grouped.drop(columns=list(df_Argc_Grouped)[0:3], inplace=False)
########################################
# print('$$$Barchart_byGroup_Data:', Barchart_byGroup_Data)
# print('$$$list(Barchart_byGroup_Data.index):', list(Barchart_byGroup_Data.index))
#############################
# Draw Map information
title_Argc = ' Arg Count by ' + cols_Split_item
cols_Split_item_correct = cols_Split_item.replace('/', ' ')
picture_Argc = cols_Split_item_correct + ' Argc Barchart'
# 计算Barchart_byGroup_Data每个column的长度, 即每个group中柱子的个数
# print('$$$list(Barchart_byGroup_Data):', list(Barchart_byGroup_Data))
length_Argc = len(Barchart_byGroup_Data[list(Barchart_byGroup_Data)[0]])
# print('$$$length_Argc:', length_Argc)
Barchart_byGroup_Argc = BarchartByGroupArgc(xlabel_Argc, Barchart_byGroup_Data, Barchart_Legend, title_Argc, picture_Argc, length_Argc, ylabel_Argc, Barchart_Legend_title, Legend_label_Argc)
Barchart_byGroup_Argc.Bar_ByGroupArgc()
##############################################
# 画Boxchart_byGroup类型
elif Config_Argc_key == 'Boxchart_byGroup_Item':
########################################
Boxchart_byGroup_Data = {}
########################################
# 去掉df_Argc_Grouped的前三列(Type, Box, cols_Split_item)
Boxchart_byGroup_Data_ref = df_Argc_Grouped.drop(columns=list(df_Argc_Grouped)[0:3], inplace=False)
########################################
# print('$$$Boxchart_byGroup_Data_ref:', Boxchart_byGroup_Data_ref)
########################################
for i in list(Boxchart_byGroup_Data_ref):
cut_index_groupsNum = 0
for Barchart_Legend_groupsNum in Barchart_Legend_groupsNums:
if Barchart_Legend_groupsNum == len(cols_Split_item_groups):
Boxchart_byGroup_Data_trans = Boxchart_byGroup_Data_ref[i].tolist()
data_format_exchange(Boxchart_byGroup_Data_trans)
Boxchart_byGroup_Data.setdefault(i, []).append(Boxchart_byGroup_Data_trans[cut_index_groupsNum:])
else:
Boxchart_byGroup_Data_trans = Boxchart_byGroup_Data_ref[i].tolist()
data_format_exchange(Boxchart_byGroup_Data_trans)
Boxchart_byGroup_Data.setdefault(i, []).append(Boxchart_byGroup_Data_trans[cut_index_groupsNum:Barchart_Legend_groupsNum])
cut_index_groupsNum = Barchart_Legend_groupsNum
# print('$$$Boxchart_byGroup_Data:', Boxchart_byGroup_Data)
#############################
# Draw Map information
title_Argc = ' Arg Count by ' + cols_Split_item
cols_Split_item_correct = cols_Split_item.replace('/', ' ')
picture_Argc = cols_Split_item_correct + ' Argc Boxchart'
# 计算Boxchart中每个group中箱型图的个数
length_Argc = len(Barchart_Legend)
# print('$$$length_Argc:', length_Argc)
Boxchart_byGroup_Argc = BarchartByGroupArgc(xlabel_Argc, Boxchart_byGroup_Data, Barchart_Legend, title_Argc, picture_Argc, length_Argc, ylabel_Argc, Barchart_Legend_title, Legend_label_Argc)
Boxchart_byGroup_Argc.Box_ByGroupArgc()
# break
print('Argc有关数据处理并作图完毕!')
四、完整的脚本如下:
代码如下:
import matplotlib
matplotlib.use('agg')
import matplotlib.pyplot as plt
import pandas as pd
import numpy as np
import glob
import os
import re
import datetime as dt
import chardet
import warnings
warnings.filterwarnings('ignore')
# 设置字体, 解决中文乱码问题
plt.rcParams['font.sans-serif'] = ['Microsoft YaHei']
# 解决图像中的'-'负号的乱码问题
plt.rcParams['axes.unicode_minus'] = False
# 获取当前脚本文件所在目录
path_current = os.getcwd()
# 获取当前脚本文件所在目录的上一级目录
path_pardir = os.path.dirname(path_current)
print(path_pardir)
file_lists_Input = glob.glob(path_pardir + '/Input/*.xlsx')
print(file_lists_Input)
file_lists_config = glob.glob(path_pardir + '/config/*.csv')
print(file_lists_config)
file_lists_split = glob.glob(path_pardir + '/split/*.csv')
print(file_lists_split)
# 自动识别文件编码格式
def get_encoding(file):
with open(file, 'rb') as f:
tmp = chardet.detect(f.read())
return tmp['encoding']
# 数据格式转换
def data_format_exchange(data_list):
for each_data in data_list:
# 判断数据是否是字符串格式
if isinstance(each_data, str):
# 若数据是字符串格式, 再判断数据是否是带%
if re.match(r'[\d.]+%', each_data, re.I):
# 若带%, 去掉%后, 再转化成float型
each_data_trans = float(each_data[:-1])
# print('The type of the number {} is {}'.format(each_data_trans, type(each_data_trans)))
else:
# 若不带%, 直接转化成float型
each_data_trans = float(each_data)
# print('The type of the number {} is {}'.format(each_data_trans, type(each_data_trans)))
index_num = data_list.index(each_data)
data_list[index_num] = each_data_trans
# 获取config数据, 并存储在字典中
def get_config_data(file_list_config):
for files in file_list_config:
dict_config = {}
encoding = get_encoding(files)
print('$$$encoding:', encoding)
pd.options.display.max_columns = None
df = pd.read_csv(files, encoding=encoding)
# print(df.tail())
# print('#' * 50)
dict_config.setdefault('Sort_Gar', {})
dict_config.setdefault('Sort_Ban', {})
dict_config.setdefault('Sort_Para', {})
dict_config.setdefault('Sort_Arg', {})
dict_config.setdefault('Sort_Argc', {})
# print('$$$dict_config:', dict_config)
for i in range(len(df['Sort_Gar'])):
dict_config['Sort_Gar'].setdefault(df['Sort_Gar'][i], []).append(df['Gar_Item'][i])
for i in range(len(df['Sort_Ban'])):
dict_config['Sort_Ban'].setdefault(df['Sort_Ban'][i], []).append(df['Ban_Item'][i])
for i in range(len(df['Sort_Para'])):
dict_config['Sort_Para'].setdefault(df['Sort_Para'][i], []).append(df['Para_Item'][i])
for i in range(len(df['Sort_Arg'])):
dict_config['Sort_Arg'].setdefault(df['Sort_Arg'][i], []).append(df['Arg_Item'][i])
for i in range(len(df['Sort_Argc'])):
dict_config['Sort_Argc'].setdefault(df['Sort_Argc'][i], []).append(df['Argc_Item'][i])
# 获取dict_config的key, 并存储在dict_config_keys中
dict_config_keys = list(dict_config)
# print('$$$dict_config_keys:', dict_config_keys)
for dict_config_key in dict_config_keys:
embedded_keys = list(dict_config[dict_config_key])
for embedded_key in embedded_keys:
if str(embedded_key) == 'nan':
del dict_config[dict_config_key][embedded_key]
# print('###dict_config是:###', dict_config)
return dict_config
# 获取split数据, 并存储在DataFrame中
def get_split_data(file_list_split):
for files in file_list_split:
encoding = get_encoding(files)
# print(encoding)
pd.options.display.max_columns = None
df_split = pd.read_csv(files, encoding=encoding)
# 删除df_split中全为空的行
df_split = df_split.dropna(axis=0, how='all')
# print(df_split.head())
# print('#' * 50)
return df_split
# 获取Input数据, 并存储起来
def get_Input_data(file_list_Input):
for files in file_list_Input:
# sheet_name=None可以让read_excel()函数读取该excel中所有的sheet
df_input_dict = pd.read_excel(files, sheet_name=None)
# print(list(df_input_dict.keys()))
# df_Gar = df_input_dict['Gar']
# df_Ban = df_input_dict['Ban']
# df_Para = df_input_dict['Para']
# df_Arg = df_input_dict['Arg']
# df_Argc = df_input_dict['Argc']
# print(df_Gar.head())
# element = df_Gar['Apple_Large_4kg'][0]
# print('The type of the element is:', type(element))
# element_trans = df_Gar['Apple_Large_4kg'].astype(float)
# print(type(element_trans))
# cols = list(df_Gar)
# print('The column label of the df is:', cols)
# for i in df_Gar['Apple_Large_4kg']:
# i = float(i[:-1])
# print('The type of the number {} is {}'.format(i, type(i)))
# data = df_Gar['Apple_Large_4kg']
# data = df_Arg['SB']
# data_format_exchange(data)
# print(data)
# print('#' * 50)
return df_input_dict
class BarchartFather:
def __init__(self, Barchart_byGroup_xlabels, Barchart_byGroup_data, Barchart_byGroup_legend, title_name, picture_name, number, Barchart_byGroup_ylabels):
self.local_path = path_pardir + '/output/' + str(Type_ID) + '_' + Nowtime + '/'
self.Barchart_byGroup_xlabels = Barchart_byGroup_xlabels
self.Barchart_byGroup_data = Barchart_byGroup_data
self.Barchart_byGroup_legend = Barchart_byGroup_legend
self.title_name = title_name
self.picture_name = picture_name
self.number = number
self.Barchart_byGroup_ylabels = Barchart_byGroup_ylabels
self.fig = plt.figure(figsize=(8, 6), facecolor='#B0C4DE')
self.ax = self.fig.add_subplot(facecolor='white')
################################################################################################################
# self.color_list = [深橙色, 纯蓝色, 纯绿色, 洋红色, 青色, 橙红色, 淡蓝色, 紫色, 纯红色, 酸橙色, 棕色, 淡珊瑚色,\
# 靛青色, 橄榄色, 水鸭色, 暗淡的灰色, 热情的粉红色, 兰花的紫色, 黑色, 深粉色, 淡钢蓝色, 橄榄土褐色,\
# 深紫罗兰色, 适中的紫色, 道奇蓝色]
################################################################################################################
self.color_list = ['#FF8C00', '#0000FF', '#008000', '#FF00FF', '#00FFFF', '#FF4500', '#87CEFA', '#800080',
'#FF0000', '#00FF00', '#A52A2A', '#F08080', '#4B0082', '#808000', '#008080', '#696969',
'#FF69B4', '#DA70D6', '#000000', '#FF1493', '#B0C4DE', '#556B2F', '#9400D3', '#9370DB', '#1E90FF']
self.length = len(self.Barchart_byGroup_xlabels)
self.x_locs = np.arange(self.length)
self.total_width = 0.8
self.box_total_width = self.total_width * 0.85
self.interval_total_width = self.total_width * 0.15
self.width = self.total_width / self.number
self.box_width = self.box_total_width / self.number
###################################################
if self.number == 1:
self.interval_width = self.interval_total_width
else:
self.interval_width = self.interval_total_width / (self.number - 1)
###################################################
if self.number % 2 == 0:
self.x1 = self.x_locs - (self.number / 2 - 1) * self.width - self.width / 2
self.x1_box = self.x_locs - (self.number / 2 - 1) * self.box_width - self.box_width / 2 - (self.number / 2 - 1) * self.interval_width - self.interval_width / 2
else:
self.x1 = self.x_locs - ((self.number - 1) / 2) * self.width
self.x1_box = self.x_locs - ((self.number - 1) / 2) * self.box_width - ((self.number - 1) / 2) * self.interval_width
self.x_list = [self.x1 + self.width * i for i in range(self.number)]
self.x_list_box = [self.x1_box + self.box_width * i + self.interval_width * i for i in range(self.number)]
# print('$$$self.x_list:', self.x_list)
# print('$$$self.x_list_box:', self.x_list_box)
class BarchartByGroupGar(BarchartFather):
def __init__(self, Barchart_byGroup_xlabels, Barchart_byGroup_data, Barchart_byGroup_legend, title_name, picture_name, number, Barchart_byGroup_ylabels):
super().__init__(Barchart_byGroup_xlabels, Barchart_byGroup_data, Barchart_byGroup_legend, title_name, picture_name, number, Barchart_byGroup_ylabels)
self.ylabels = ['0%', '10%', '20%', '30%', '40%', '50%', '60%', '70%', '80%', '90%', '100%']
self.y_locs = np.arange(0, 110, 10)
def Bar_ByGroupGar(self):
for i in range(self.number):
Barchart_byGroup_data_tmp = self.Barchart_byGroup_data[i]
data_format_exchange(Barchart_byGroup_data_tmp)
#############################################################################
# 判断用data_format_exchange函数转化之前的对象是否为字符串:1表示是, 0表示否
each_Bbdt_flag = 0
for each_Bbdt in Barchart_byGroup_data_tmp:
if each_Bbdt > 1:
each_Bbdt_flag = 1
break
if each_Bbdt_flag == 0:
Barchart_byGroup_data_tmp1 = []
for each_Bbdt in Barchart_byGroup_data_tmp:
each_Bbdt = each_Bbdt * 100
Barchart_byGroup_data_tmp1.append(each_Bbdt)
Barchart_byGroup_data_tmp = Barchart_byGroup_data_tmp1
#############################################################################
# print('$$$len(self.x_list[i]):', len(self.x_list[i]))
# print('$$$len(Barchart_byGroup_data_tmp):', len(Barchart_byGroup_data_tmp))
self.ax.bar(self.x_list[i], Barchart_byGroup_data_tmp, color=self.color_list[i], width=self.width, label=self.Barchart_byGroup_legend[i])
self.ax.grid(True, ls=':', color='b', alpha=0.3)
plt.title(self.title_name, fontweight='bold', pad=25)
self.ax.set_xticks(self.x_locs)
self.ax.set_yticks(self.y_locs)
self.ax.set_xticklabels(self.Barchart_byGroup_xlabels, rotation=90)
self.ax.set_yticklabels(self.ylabels)
self.ax.set_ylabel(self.Barchart_byGroup_ylabels, fontweight='bold')
#################################################################################
# 添加双轴
ax_twinx = self.ax.twinx()
#################################################################################
# 准备好画LmaxRatio和LminRatio的数据
Barchart_byGroup_data_Large = self.Barchart_byGroup_data[0]
Barchart_byGroup_data_Middle = self.Barchart_byGroup_data[1]
Barchart_byGroup_data_Small = self.Barchart_byGroup_data[2]
data_format_exchange(Barchart_byGroup_data_Large)
data_format_exchange(Barchart_byGroup_data_Middle)
data_format_exchange(Barchart_byGroup_data_Small)
LmaxRatio = []
LminRatio = []
for i in range(len(Barchart_byGroup_data_Large)):
if Barchart_byGroup_data_Middle[i] == 0:
LmaxRatio_tmp = 0
LminRatio_tmp = 0
LmaxRatio.append(LmaxRatio_tmp)
LminRatio.append(LminRatio_tmp)
else:
LmaxRatio_tmp = (Barchart_byGroup_data_Large[i] / Barchart_byGroup_data_Middle[i]) * 100
LminRatio_tmp = (Barchart_byGroup_data_Small[i] / Barchart_byGroup_data_Middle[i]) * 100
LmaxRatio.append(LmaxRatio_tmp)
LminRatio.append(LminRatio_tmp)
#################################################################################
# 画LmaxRatio和LminRatio
ax_twinx.plot(self.x_locs, LmaxRatio, linestyle='-', marker='o', markersize=3, color=self.color_list[0], label='LmaxRatio')
ax_twinx.plot(self.x_locs, LminRatio, linestyle='-', marker='o', markersize=3, color=self.color_list[2], label='LminRatio')
################################################################################################################
################################################################################################################
self.fig.legend(loc='upper center', bbox_to_anchor=(0.5, 0.96), frameon=False, ncol=5, handlelength=0.9,
handleheight=0.9, fontsize='small')
################################################################################################################
################################################################################################################
ax_twinx.set_ylabel('LminRatio, LmaxRatio', fontweight='bold')
################################################################################################################
self.fig.tight_layout()
###########################################
###########################################
self.fig.subplots_adjust(top=0.9)
###########################################
###########################################
plt.savefig(self.local_path + self.picture_name + '.jpg', facecolor=self.fig.get_facecolor())
plt.clf()
plt.close(self.fig)
class BarchartByGroupBan(BarchartFather):
def __init__(self, Barchart_byGroup_xlabels, Barchart_byGroup_data, Barchart_byGroup_legend, title_name, picture_name, number, Barchart_byGroup_ylabels):
super().__init__(Barchart_byGroup_xlabels, Barchart_byGroup_data, Barchart_byGroup_legend, title_name, picture_name, number, Barchart_byGroup_ylabels)
def Bar_ByGroupBan(self):
for i in range(self.number):
Barchart_byGroup_data_tmp = self.Barchart_byGroup_data[i]
data_format_exchange(Barchart_byGroup_data_tmp)
self.ax.bar(self.x_list[i], Barchart_byGroup_data_tmp, color=self.color_list[i], width=self.width, label=self.Barchart_byGroup_legend[i])
self.ax.grid(True, ls=':', color='b', alpha=0.3)
plt.title(self.title_name, fontweight='bold', pad=25)
self.ax.set_xticks(self.x_locs)
self.ax.set_xticklabels(self.Barchart_byGroup_xlabels, rotation=90)
self.ax.set_ylabel(self.Barchart_byGroup_ylabels, fontweight='bold')
################################################################################################################
################################################################################################################
self.fig.legend(loc='upper center', bbox_to_anchor=(0.5, 0.96), frameon=False, ncol=5, handlelength=0.9,
handleheight=0.9, fontsize='small')
################################################################################################################
################################################################################################################
self.fig.tight_layout()
#############################################
#############################################
self.fig.subplots_adjust(top=0.9)
#############################################
#############################################
plt.savefig(self.local_path + self.picture_name + '.jpg', facecolor=self.fig.get_facecolor())
plt.clf()
plt.close(self.fig)
class BarchartSinglePara(BarchartFather):
def __init__(self, Barchart_xlabels, Barchart_data, Barchart_legend, title_name, picture_name, number, Barchart_ylabels, Barchart_legend_title):
super().__init__(Barchart_xlabels, Barchart_data, Barchart_legend, title_name, picture_name, number, Barchart_ylabels)
self.Barchart_legend_title = Barchart_legend_title
def Bar_Para(self):
# each_legend_number用来存放每个legend对应的柱子的数量, 注意这个数量list是累加的
# 形如[num1, num1 + num2, num1 + num2 + num3, ...]
each_legend_number = []
# color_index用来存放color_list中每个color的索引
color_index = []
each_legend_number_sum = 0
for i in self.Barchart_byGroup_legend:
each_legend_number_tmp = len(self.Barchart_byGroup_data[i])
each_legend_number_sum = each_legend_number_sum + each_legend_number_tmp
each_legend_number.append(each_legend_number_sum)
for i in range(len(self.Barchart_byGroup_legend)):
color_index.append(i)
# cut_index用来列表切片
cut_index = 0
# count_index用来计算列表切片时是否已经切到最后一段, 因为最后一段的切片方式和其他段不同, 要用[start_index:]
count_index = 1
for color_i, legend_n, each_legend in zip(color_index, each_legend_number, self.Barchart_byGroup_legend):
Barchart_byGroup_data_tmp = self.Barchart_byGroup_data[each_legend]
data_format_exchange(Barchart_byGroup_data_tmp)
############################################################################################################
############################################################################################################
###################### 注意如下两句语句的区别, 很容易出错 #######################################################
############# print('$$$self.x_list[cut_index:legend_n]:', self.x_list[cut_index:legend_n]) ################
############# print('$$$self.x_list[cut_index:legend_n]:', self.x_list[0][cut_index:legend_n]) #############
############################################################################################################
############################################################################################################
# 如果legend的值为None, 就把legend设为空值
if each_legend == 'None':
each_legend = ' '
if count_index == len(self.Barchart_byGroup_legend):
self.ax.bar(self.x_list[0][cut_index:], Barchart_byGroup_data_tmp, color=self.color_list[color_i],
width=self.width, label=each_legend)
else:
self.ax.bar(self.x_list[0][cut_index:legend_n], Barchart_byGroup_data_tmp,
color=self.color_list[color_i], width=self.width, label=each_legend)
cut_index = legend_n
count_index += 1
self.ax.grid(True, ls=':', color='b', alpha=0.3)
plt.title(self.title_name, fontweight='bold')
self.ax.set_xticks(self.x_locs)
self.ax.set_xticklabels(self.Barchart_byGroup_xlabels, rotation=90)
self.ax.set_ylabel(self.Barchart_byGroup_ylabels, fontweight='bold')
################################################################################################################
################################################################################################################
########## 注意如下两句语句的区别, 很容易出错! ######################################################################
########## plt.legend(title=self.Barchart_legend_title, loc='center left', bbox_to_anchor=(1.02, 0.5), #########
########## facecolor='None', edgecolor='#000000', frameon=True, ncol=1, handlelength=0.9, ############
########## handleheight=0.9, borderaxespad=0) ########################################################
################################################################################################################
########## self.fig.legend(title=self.Barchart_legend_title, loc='center left', bbox_to_anchor=(1.02, 0.5), ####
########## facecolor='None', edgecolor='#000000', frameon=True, ncol=1, handlelength=0.9, ############
########## handleheight=0.9, borderaxespad=0) ########################################################
################################################################################################################
################################################################################################################
plt.legend(title=self.Barchart_legend_title, loc='center left', bbox_to_anchor=(1.02, 0.5), facecolor='None',
edgecolor='#000000', frameon=True, ncol=1, handlelength=0.9, handleheight=0.9, borderaxespad=0,
fontsize='small')
################################################################################################################
################################################################################################################
self.fig.tight_layout()
############################################
############################################
plt.savefig(self.local_path + self.picture_name + '.jpg', facecolor=self.fig.get_facecolor())
plt.clf()
plt.close(self.fig)
class BarchartByGroupArg(BarchartFather):
def __init__(self, Barchart_byGroup_xlabels, Barchart_byGroup_data, Barchart_byGroup_legend, title_name,
picture_name, number, Barchart_byGroup_ylabels, Barchart_legend_title, legend_label_Arg):
super().__init__(Barchart_byGroup_xlabels, Barchart_byGroup_data, Barchart_byGroup_legend, title_name,
picture_name, number, Barchart_byGroup_ylabels)
self.Barchart_legend_title = Barchart_legend_title
self.legend_label_Arg = legend_label_Arg
self.ylabels = ['0%', '10%', '20%', '30%', '40%', '50%', '60%', '70%', '80%', '90%', '100%']
self.y_locs = np.arange(0, 110, 10)
def Bar_ByGroupArg(self):
iterate_list = []
# print('$$$list(self.Barchart_byGroup_legend.keys()):', list(self.Barchart_byGroup_legend.keys()))
for i_key in list(self.Barchart_byGroup_legend.keys()):
for j_value in list(self.Barchart_byGroup_legend[i_key]):
iterate_list.append(j_value)
# print('$$$iterate_list:', iterate_list)
# print('$$$self.number:', self.number)
for i, color_idx in zip(range(self.number), iterate_list):
Barchart_byGroup_data_tmp = self.Barchart_byGroup_data.iloc[i, :].tolist()
data_format_exchange(Barchart_byGroup_data_tmp)
# print('$$$len(self.x_list[i]):', len(self.x_list[i]))
# print('$$$len(Barchart_byGroup_data_tmp):', len(Barchart_byGroup_data_tmp))
#############################################################################
# 判断用data_format_exchange函数转化之前的对象是否为字符串:1表示是, 0表示否
each_Bbdt_flag = 0
for each_Bbdt in Barchart_byGroup_data_tmp:
if each_Bbdt > 1:
each_Bbdt_flag = 1
break
if each_Bbdt_flag == 0:
Barchart_byGroup_data_tmp1 = []
for each_Bbdt in Barchart_byGroup_data_tmp:
each_Bbdt = each_Bbdt * 100
Barchart_byGroup_data_tmp1.append(each_Bbdt)
Barchart_byGroup_data_tmp = Barchart_byGroup_data_tmp1
#############################################################################
self.ax.bar(self.x_list[i], Barchart_byGroup_data_tmp, color=self.color_list[color_idx], width=self.width,
label=self.legend_label_Arg[i])
self.ax.grid(True, ls=':', color='b', alpha=0.3)
plt.title(self.title_name, fontweight='bold')
self.ax.set_xticks(self.x_locs)
self.ax.set_yticks(self.y_locs)
self.ax.set_xticklabels(self.Barchart_byGroup_xlabels, rotation=90)
self.ax.set_yticklabels(self.ylabels)
self.ax.set_ylabel(self.Barchart_byGroup_ylabels, fontweight='bold')
################################################################################################################
################################################################################################################
plt.legend(title=self.Barchart_legend_title, loc='center left', bbox_to_anchor=(1.02, 0.5), facecolor='None',
edgecolor='#000000', frameon=True, ncol=1, handlelength=0.9, handleheight=0.9, borderaxespad=0,
handletextpad=0.1, fontsize='small')
################################################################################################################
################################################################################################################
self.fig.tight_layout()
###################################
###################################
plt.savefig(self.local_path + self.picture_name + '.jpg', facecolor=self.fig.get_facecolor())
plt.clf()
plt.close(self.fig)
def Box_ByGroupArg(self):
for i in range(self.number):
#####################################################################
# 先画boxplot
#######################
# boxplot_data_num用来统计每组数据的长度, 画scatter图时会用到
boxplot_data_num = []
#######################
boxplot_data = []
for j_key in list(self.Barchart_byGroup_data):
boxplot_data_tmp = self.Barchart_byGroup_data[j_key][i]
boxplot_data.append(boxplot_data_tmp)
boxplot_data_num_tmp = len(self.Barchart_byGroup_data[j_key][i])
boxplot_data_num.append(boxplot_data_num_tmp)
self.ax.boxplot(boxplot_data, positions=self.x_list_box[i], widths=self.box_width,
patch_artist=True, medianprops={'lw': 1, 'color': self.color_list[i]},
boxprops={'facecolor': 'None', 'edgecolor': self.color_list[i]},
capprops={'lw': 1, 'color': self.color_list[i]},
whiskerprops={'ls': '-', 'lw': 1, 'color': self.color_list[i]},
showfliers=False,
zorder=1)
#####################################################################
# flierprops={'marker': 's', 'markerfacecolor': self.color_list[i], 'markeredgecolor': self.color_list[i], 'markersize': 3},
# 再画scatter
# 将每一组箱线图统计的所有点绘制在图上
# spotx是每一组箱线图所有的点的横坐标
spotx = []
for j_spotx, k_spotx in zip(self.x_list_box[i], boxplot_data_num):
spotx_tmp = [j_spotx] * k_spotx
spotx.append(spotx_tmp)
label_Arg_Boxchart = list(self.Barchart_byGroup_legend)[i]
if label_Arg_Boxchart == 'None':
label_Arg_Boxchart = ' '
self.ax.scatter(spotx, boxplot_data, c=self.color_list[i], s=3,
label=label_Arg_Boxchart,
zorder=2)
#####################################################################
self.ax.grid(True, ls=':', color='b', alpha=0.3)
plt.title(self.title_name, fontweight='bold')
self.ax.set_xticks(self.x_locs)
self.ax.set_yticks(self.y_locs)
self.ax.set_xticklabels(self.Barchart_byGroup_xlabels, rotation=90)
self.ax.set_yticklabels(self.ylabels)
self.ax.set_ylabel(self.Barchart_byGroup_ylabels, fontweight='bold')
################################################################################################################
################################################################################################################
plt.legend(title=self.Barchart_legend_title, loc='center left', bbox_to_anchor=(1.02, 0.5), facecolor='None',
edgecolor='#000000', frameon=True, ncol=1, markerscale=3, borderaxespad=0, handletextpad=0.1,
fontsize='small')
################################################################################################################
################################################################################################################
self.fig.tight_layout()
##################################
##################################
plt.savefig(self.local_path + self.picture_name + '.jpg', facecolor=self.fig.get_facecolor())
plt.clf()
plt.close(self.fig)
class BarchartByGroupArgc(BarchartFather):
def __init__(self, Barchart_byGroup_xlabels, Barchart_byGroup_data, Barchart_byGroup_legend, title_name,
picture_name, number, Barchart_byGroup_ylabels, Barchart_legend_title, legend_label_Argc):
super().__init__(Barchart_byGroup_xlabels, Barchart_byGroup_data, Barchart_byGroup_legend, title_name,
picture_name, number, Barchart_byGroup_ylabels)
self.Barchart_legend_title = Barchart_legend_title
self.legend_label_Argc = legend_label_Argc
def Bar_ByGroupArgc(self):
iterate_list = []
for i_key in list(self.Barchart_byGroup_legend.keys()):
for j_value in list(self.Barchart_byGroup_legend[i_key]):
iterate_list.append(j_value)
for i, color_idx in zip(range(self.number), iterate_list):
Barchart_byGroup_data_tmp = self.Barchart_byGroup_data.iloc[i, :].tolist()
data_format_exchange(Barchart_byGroup_data_tmp)
self.ax.bar(self.x_list[i], Barchart_byGroup_data_tmp, color=self.color_list[color_idx], width=self.width,
label=self.legend_label_Argc[i])
self.ax.grid(True, ls=':', color='b', alpha=0.3)
plt.title(self.title_name, fontweight='bold')
self.ax.set_xticks(self.x_locs)
self.ax.set_xticklabels(self.Barchart_byGroup_xlabels, rotation=90)
self.ax.set_ylabel(self.Barchart_byGroup_ylabels, fontweight='bold')
################################################################################################################
################################################################################################################
plt.legend(title=self.Barchart_legend_title, loc='center left', bbox_to_anchor=(1.02, 0.5), facecolor='None',
edgecolor='#000000', frameon=True, ncol=1, handlelength=0.9, handleheight=0.9, borderaxespad=0,
handletextpad=0.1, fontsize='small')
################################################################################################################
################################################################################################################
self.fig.tight_layout()
##################################
##################################
plt.savefig(self.local_path + self.picture_name + '.jpg', facecolor=self.fig.get_facecolor())
plt.clf()
plt.close(self.fig)
def Box_ByGroupArgc(self):
for i in range(self.number):
#####################################################################
# 先画boxplot
#######################
# boxplot_data_num用来统计每组数据的长度, 画scatter图时会用到
boxplot_data_num = []
#######################
boxplot_data = []
for j_key in list(self.Barchart_byGroup_data):
boxplot_data_tmp = self.Barchart_byGroup_data[j_key][i]
boxplot_data.append(boxplot_data_tmp)
boxplot_data_num_tmp = len(self.Barchart_byGroup_data[j_key][i])
boxplot_data_num.append(boxplot_data_num_tmp)
self.ax.boxplot(boxplot_data, positions=self.x_list_box[i], widths=self.box_width,
patch_artist=True, medianprops={'lw': 1, 'color': self.color_list[i]},
boxprops={'facecolor': 'None', 'edgecolor': self.color_list[i]},
capprops={'lw': 1, 'color': self.color_list[i]},
whiskerprops={'ls': '-', 'lw': 1, 'color': self.color_list[i]},
showfliers=False,
zorder=1)
#####################################################################
# flierprops={'marker': 's', 'markerfacecolor': self.color_list[i], 'markeredgecolor': self.color_list[i], 'markersize': 3},
# 再画scatter
# 将每一组箱线图统计的所有点绘制在图上
# spotx是每一组箱线图所有的点的横坐标
spotx = []
for j_spotx, k_spotx in zip(self.x_list_box[i], boxplot_data_num):
spotx_tmp = [j_spotx] * k_spotx
spotx.append(spotx_tmp)
label_Argc_Boxchart = list(self.Barchart_byGroup_legend)[i]
if label_Argc_Boxchart == 'None':
label_Argc_Boxchart = ' '
self.ax.scatter(spotx, boxplot_data, c=self.color_list[i], s=3,
label=label_Argc_Boxchart,
zorder=2)
#####################################################################
self.ax.grid(True, ls=':', color='b', alpha=0.3)
plt.title(self.title_name, fontweight='bold')
self.ax.set_xticks(self.x_locs)
self.ax.set_xticklabels(self.Barchart_byGroup_xlabels, rotation=90)
self.ax.set_ylabel(self.Barchart_byGroup_ylabels, fontweight='bold')
################################################################################################################
################################################################################################################
plt.legend(title=self.Barchart_legend_title, loc='center left', bbox_to_anchor=(1.02, 0.5), facecolor='None',
edgecolor='#000000', frameon=True, ncol=1, markerscale=3, borderaxespad=0, handletextpad=0.1,
fontsize='small')
################################################################################################################
################################################################################################################
self.fig.tight_layout()
##################################
##################################
plt.savefig(self.local_path + self.picture_name + '.jpg', facecolor=self.fig.get_facecolor())
plt.clf()
plt.close(self.fig)
if __name__ == '__main__':
df_Input_dict = get_Input_data(file_lists_Input)
Input_flag = list(df_Input_dict)
print('$$$Input_flag:', Input_flag)
df_Split = get_split_data(file_lists_split)
Type_ID = df_Split[list(df_Split)[0]].tolist()[0]
Nowtime = dt.datetime.now().strftime('%Y-%m-%d-%H_%M_%S')
os.makedirs(path_pardir + '/output/' + str(Type_ID) + '_' + Nowtime)
dict_Config = get_config_data(file_lists_config)
# print(df_Split)
print('#' * 50)
# 获取df_Split的列标签
df_Split_cols = list(df_Split)
# print('$$$df_Split_cols:', df_Split_cols)
# 获取df_Split的列标签中属于split类型的标签, 即去除前两列的Type和Box这两个列标签
cols_Split_items = df_Split_cols[2:]
# print('$$$cols_Split_items:', cols_Split_items)
for input_flag in Input_flag:
################################################################################################################
# Gar
################################################################################################################
if input_flag == 'Gar':
print('正在处理Gar有关数据并作图, 请稍等...')
df_Gar = df_Input_dict['Gar']
df_Gar = df_Gar.dropna(axis=0, how='all')
# print('$$$df_Gar:', df_Gar.head())
# print('$$$df_Gar.Type:', df_Gar.Type)
# print('$$$df_Gar的列标签', list(df_Gar))
#############################################
df_Split_copy = df_Split.copy()
df_Split_copy = df_Split_copy.fillna('None')
#############################################
Config_Gar = dict_Config['Sort_Gar']
#############################################
for cols_Split_item in cols_Split_items:
###################################################################################
index_list_Gar = df_Split_copy[cols_Split_item].tolist()
index_dict_Gar = {}
byGroup_list_Gar = []
###################################################################################
df_Gar.insert(2, cols_Split_item, df_Split_copy.pop(cols_Split_item))
###################################################################################
# print('$$$df_Gar:', df_Gar)
# df.groupby()返回的是一个对象类型(object), 不是DataFrame类型
###################################################################################
df_Gar_byGroup = df_Gar.groupby(cols_Split_item, as_index=False)
###################################################################################
# print('$$$df_Gar_byGroup:', df_Gar_byGroup)
###################################################################################
result_Gar = zip(*df_Gar_byGroup)
n, g = [list(i) for i in result_Gar]
###################################################################################
for name, group in df_Gar_byGroup:
# print('$$$name:', name)
# print(group)
index_dict_Gar[name] = index_list_Gar.index(name)
# print('$$$index_dict_Gar:', index_dict_Gar)
###################################################################################
v = list(index_dict_Gar.values())
# print('$$$v:', v)
df_Gar_byGroup_zipped = zip(n, g, v)
df_Gar_byGroup_sorted = sorted(df_Gar_byGroup_zipped, key=lambda x: x[2])
###################################################################################
for name, group, value in df_Gar_byGroup_sorted:
# 对df.groupby()返回的对象使用get_group()方法, 从而得到每个group对应的DataFrame类型
# get_group()方法一次只能得到其中一个group, 如果有多个group需要多次调用get_group()
df_Gar_byGroup_temp = df_Gar_byGroup.get_group(name)
byGroup_list_Gar.append(df_Gar_byGroup_temp)
# 用pd.concat()方法把多个DataFrame拼接成一个
df_Gar_Grouped = pd.concat(byGroup_list_Gar)
# print('$$$df_Gar_Grouped:', df_Gar_Grouped)
###################################################################################
df_Gar.pop(cols_Split_item)
# print('$$$df_Gar_pop:', df_Gar)
###################################################################################
# 准备好xlabel
Split_list_Gar = df_Gar_Grouped[cols_Split_item].tolist()
# print('$$$Split_list_Gar:', Split_list_Gar)
xlabel_Gar = []
for Split_item, Split_item_index in zip(Split_list_Gar, range(len(Split_list_Gar))):
if Split_list_Gar[Split_item_index] == 'None':
Split_item = ''
Type_ID_Gar = df_Gar_Grouped[list(df_Gar_Grouped)[0]].tolist()[Split_item_index]
Box_ID_Gar = df_Gar_Grouped[list(df_Gar_Grouped)[1]].tolist()[Split_item_index]
if len(str(Box_ID_Gar)) == 1:
xlabel_Gar_tmp = Split_item + '::' + str(Type_ID_Gar) + '::B0' + str(Box_ID_Gar)
# xlabel_Gar_tmp = Split_item + '::B0' + str(Box_ID_Gar)
xlabel_Gar.append(xlabel_Gar_tmp)
else:
xlabel_Gar_tmp = Split_item + '::' + str(Type_ID_Gar) + '::B' + str(Box_ID_Gar)
# xlabel_Gar_tmp = Split_item + '::B' + str(Box_ID_Gar)
xlabel_Gar.append(xlabel_Gar_tmp)
# print('$$$xlabel_Gar:', xlabel_Gar)
########################################################################################################
# 根据Config判断画哪种图
# print('$$$Config_Gar:', Config_Gar)
############################################################
for Config_Gar_key in list(Config_Gar.keys()):
########################################################
# 画Barchart_byGroup类型
if Config_Gar_key == 'Barchart_byGroup_Item':
Barchart_byGroup_Data = {}
Barchart_byGroup_Legend = {}
for Config_Gar_value in Config_Gar[Config_Gar_key]:
if re.match(r'A.*[LMS].*[el].4kg', Config_Gar_value, re.I):
Apple_LMSe_4kg = re.match(r'A.*[LMS].*[el].4kg', Config_Gar_value, re.I)
Barchart_byGroup_Data.setdefault('Apple_L_M_S_4kg', []).append(df_Gar_Grouped[Config_Gar_value].tolist())
Barchart_byGroup_Legend.setdefault('Apple_L_M_S_4kg', []).append(Apple_LMSe_4kg.group())
elif re.match(r'A.*[LMS].*[el].8kg', Config_Gar_value, re.I):
Apple_LMSe_8kg = re.match(r'A.*[LMS].*[el].8kg', Config_Gar_value, re.I)
Barchart_byGroup_Data.setdefault('Apple_L_M_S_8kg', []).append(df_Gar_Grouped[Config_Gar_value].tolist())
Barchart_byGroup_Legend.setdefault('Apple_L_M_S_8kg', []).append(Apple_LMSe_8kg.group())
elif re.match(r'A.*[LMS].*[el].16kg', Config_Gar_value, re.I):
Apple_LMSe_16kg = re.match(r'A.*[LMS].*[el].16kg', Config_Gar_value, re.I)
Barchart_byGroup_Data.setdefault('Apple_L_M_S_16kg', []).append(df_Gar_Grouped[Config_Gar_value].tolist())
Barchart_byGroup_Legend.setdefault('Apple_L_M_S_16kg', []).append(Apple_LMSe_16kg.group())
# print('$$$Barchart_byGroup_Data:', Barchart_byGroup_Data)
# print('$$$Barchart_byGroup_Legend:', Barchart_byGroup_Legend)
########################################################################################################################
# Draw Map information
title_Gar = ' L/M/S Gar Trend order by ' + cols_Split_item
for key in list(Barchart_byGroup_Data):
cols_Split_item_correct = cols_Split_item.replace('/', ' ')
picture_Gar = cols_Split_item_correct + ' ' + key
length_Gar = len(Barchart_byGroup_Data[key])
Barchart_byGroup_Gar = BarchartByGroupGar(xlabel_Gar, Barchart_byGroup_Data[key], Barchart_byGroup_Legend[key], title_Gar, picture_Gar, length_Gar, key)
Barchart_byGroup_Gar.Bar_ByGroupGar()
# break
print('Gar有关数据处理并作图完毕!')
################################################################################################################
# Ban
################################################################################################################
elif input_flag == 'Ban':
print('正在处理Ban有关数据并作图, 请稍等...')
df_Ban = df_Input_dict['Ban']
df_Ban = df_Ban.dropna(axis=0, how='all')
# print('$$$df_Ban:', df_Ban.head())
# print('$$$df_Ban.Type:', df_Ban.Type)
# print('$$$df_Ban的列标签:', list(df_Ban))
#############################################################################
df_Split_copy = df_Split.copy()
df_Split_copy = df_Split_copy.fillna('None')
###############################################
Config_Ban = dict_Config['Sort_Ban']
###############################################
for cols_Split_item in cols_Split_items:
#########################################################################
index_list_Ban = df_Split_copy[cols_Split_item].tolist()
index_dict_Ban = {}
byGroup_list_Ban = []
#########################################################################
df_Ban.insert(2, cols_Split_item, df_Split_copy.pop(cols_Split_item))
#########################################################################
# print('$$$df_Ban:', df_Ban)
# df.groupby()返回的是一个对象类型(object), 不是DataFrame类型
#########################################################################
df_Ban_byGroup = df_Ban.groupby(cols_Split_item, as_index=False)
#########################################################################
# print('$$$df_Ban_byGroup:', df_Ban_byGroup)
#########################################################################
result_Ban = zip(*df_Ban_byGroup)
n, g = [list(i) for i in result_Ban]
#########################################################################
for name, group in df_Ban_byGroup:
# print('$$$name:', name)
# print(group)
index_dict_Ban[name] = index_list_Ban.index(name)
# print('$$$index_dict_Ban:', index_dict_Ban)
#########################################################################
v = list(index_dict_Ban.values())
# print('$$$v:', v)
df_Ban_byGroup_zipped = zip(n, g, v)
df_Ban_byGroup_sorted = sorted(df_Ban_byGroup_zipped, key=lambda x: x[2])
#########################################################################
for name, group, value in df_Ban_byGroup_sorted:
df_Ban_byGroup_temp = df_Ban_byGroup.get_group(name)
byGroup_list_Ban.append(df_Ban_byGroup_temp)
# 用pd.concat()方法把多个DataFrame拼接成一个
df_Ban_Grouped = pd.concat(byGroup_list_Ban)
# print('$$$df_Ban_Grouped:', df_Ban_Grouped)
#########################################################################
df_Ban.pop(cols_Split_item)
# print('$$$df_Ban_pop:', df_Ban)
#########################################################################
# 准备好xlabel
Split_list_Ban = df_Ban_Grouped[cols_Split_item].tolist()
# print('$$$Split_list_Ban:', Split_list_Ban)
xlabel_Ban = []
for Split_item, Split_item_index in zip(Split_list_Ban, range(len(Split_list_Ban))):
if Split_list_Ban[Split_item_index] == 'None':
Split_item = ''
Type_ID_Ban = df_Ban_Grouped[list(df_Ban_Grouped)[0]].tolist()[Split_item_index]
Box_ID_Ban = df_Ban_Grouped[list(df_Ban_Grouped)[1]].tolist()[Split_item_index]
if len(str(Box_ID_Ban)) == 1:
xlabel_Ban_tmp = Split_item + '::' + str(Type_ID_Ban) + '::B0' + str(Box_ID_Ban)
xlabel_Ban.append(xlabel_Ban_tmp)
else:
xlabel_Ban_tmp = Split_item + '::' + str(Type_ID_Ban) + '::B' + str(Box_ID_Ban)
xlabel_Ban.append(xlabel_Ban_tmp)
# print('$$$xlabel_Ban:', xlabel_Ban)
#########################################################################
# 根据Config判断画哪种图
# print('$$$Config_Ban:', Config_Ban)
#########################################################################
for Config_Ban_key in list(Config_Ban.keys()):
#####################################################################
# 画Barchart_byGroup类型
if Config_Ban_key == 'Barchart_byGroup_Item':
Barchart_byGroup_Data = {}
Barchart_byGroup_Legend = {}
for Config_Ban_value in Config_Ban[Config_Ban_key]:
if re.match(r'A.*[LMS].*[el].4kg', Config_Ban_value, re.I):
Apple_LMSe_4kg = re.match(r'A.*[LMS].*[el].4kg', Config_Ban_value, re.I)
Barchart_byGroup_Data.setdefault('Apple_L_M_S_4kg_Ban', []).append(df_Ban_Grouped[Config_Ban_value].tolist())
Barchart_byGroup_Legend.setdefault('Apple_L_M_S_4kg_Ban', []).append(Apple_LMSe_4kg.group())
elif re.match(r'A.*[LMS].*[el].8kg', Config_Ban_value, re.I):
Apple_LMSe_8kg = re.match(r'A.*[LMS].*[el].8kg', Config_Ban_value, re.I)
Barchart_byGroup_Data.setdefault('Apple_L_M_S_8kg_Ban', []).append(df_Ban_Grouped[Config_Ban_value].tolist())
Barchart_byGroup_Legend.setdefault('Apple_L_M_S_8kg_Ban', []).append(Apple_LMSe_8kg.group())
elif re.match(r'A.*[LMS].*[el].16kg', Config_Ban_value, re.I):
Apple_LMSe_16kg = re.match(r'A.*[LMS].*[el].16kg', Config_Ban_value, re.I)
Barchart_byGroup_Data.setdefault('Apple_L_M_S_16kg_Ban', []).append(df_Ban_Grouped[Config_Ban_value].tolist())
Barchart_byGroup_Legend.setdefault('Apple_L_M_S_16kg_Ban', []).append(Apple_LMSe_16kg.group())
# print('$$$Barchart_byGroup_Data:', Barchart_byGroup_Data)
# print('$$$Barchart_byGroup_Legend:', Barchart_byGroup_Legend)
################################################################################################
# Draw Map information
title_Ban = ' L/M/S Ban Trend order by ' + cols_Split_item
for key in list(Barchart_byGroup_Data):
cols_Split_item_correct = cols_Split_item.replace('/', ' ')
picture_Ban = cols_Split_item_correct + ' ' + key
length_Ban = len(Barchart_byGroup_Data[key])
Barchart_byGroup_Ban = BarchartByGroupBan(xlabel_Ban, Barchart_byGroup_Data[key], Barchart_byGroup_Legend[key], title_Ban, picture_Ban, length_Ban, key)
Barchart_byGroup_Ban.Bar_ByGroupBan()
# break
print('Ban有关数据处理并作图完毕!')
################################################################################################################
# Para
################################################################################################################
elif input_flag == 'Para':
print('正在处理Para有关数据并作图, 请稍等...')
df_Para = df_Input_dict['Para']
df_Para = df_Para.dropna(axis=0, how='all')
# print('$$$df_Para:', df_Para.head())
# print('$$$df_Para.Type:', df_Para.Type)
# print('$$$df_Para的列标签:', list(df_Para))
########################################################
df_Split_copy = df_Split.copy()
df_Split_copy = df_Split_copy.fillna('None')
########################################################
Config_Para = dict_Config['Sort_Para']
########################################################
for cols_Split_item in cols_Split_items:
###############################################################################
index_list_Para = df_Split_copy[cols_Split_item].tolist()
index_dict_Para = {}
byGroup_list_Para = []
###############################################################################
df_Para.insert(2, cols_Split_item, df_Split_copy.pop(cols_Split_item))
###############################################################################
# print('$$$df_Para:', df_Para)
# df.groupby()返回的是一个对象类型(object), 不是DataFrame类型
###############################################################################
df_Para_byGroup = df_Para.groupby(cols_Split_item, as_index=False)
###############################################################################
# print('$$$df_Para_byGroup:', df_Para_byGroup)
###############################################################################
result_Para = zip(*df_Para_byGroup)
n, g = [list(i) for i in result_Para]
###############################################################################
for name, group in df_Para_byGroup:
# print('$$$name:', name)
# print('$$$group:', group)
index_dict_Para[name] = index_list_Para.index(name)
# print('$$$index_dict_Para:', index_dict_Para)
###############################################################################
v = list(index_dict_Para.values())
# print('$$$v:', v)
df_Para_byGroup_zipped = zip(n, g, v)
df_Para_byGroup_sorted = sorted(df_Para_byGroup_zipped, key=lambda x: x[2])
###############################################################################
for name, group, value in df_Para_byGroup_sorted:
df_Para_byGroup_temp = df_Para_byGroup.get_group(name)
byGroup_list_Para.append(df_Para_byGroup_temp)
# 用pd.concat()方法把多个DataFrame拼接成一个
df_Para_Grouped = pd.concat(byGroup_list_Para)
# print('$$$df_Para_Grouped:', df_Para_Grouped)
###############################################################################
df_Para.pop(cols_Split_item)
# print('$$$df_Para_pop:', df_Para)
###############################################################################
# 准备好xlabel
Split_list_Para = df_Para_Grouped[cols_Split_item].tolist()
# print('$$$Split_list_Para:', Split_list_Para)
xlabel_Para = []
for Split_item, Split_item_index in zip(Split_list_Para, range(len(Split_list_Para))):
if Split_list_Para[Split_item_index] == 'None':
Split_item = ''
Type_ID_Para = df_Para_Grouped[list(df_Para_Grouped)[0]].tolist()[Split_item_index]
Box_ID_Para = df_Para_Grouped[list(df_Para_Grouped)[1]].tolist()[Split_item_index]
if len(str(Box_ID_Para)) == 1:
xlabel_Para_tmp = Split_item + '::' + str(Type_ID_Para) + '::B0' + str(Box_ID_Para)
xlabel_Para.append(xlabel_Para_tmp)
else:
xlabel_Para_tmp = Split_item + '::' + str(Type_ID_Para) + '::B' + str(Box_ID_Para)
xlabel_Para.append(xlabel_Para_tmp)
# print('$$$xlabel_Para:', xlabel_Para)
###############################################################################
# 准备好ylabel
ylabel_Para = 'Median'
###############################################################################
# 准备好图例的标题Legend_title和图例Legend
Barchart_Legend_title = cols_Split_item
# print('$$$$$$---This Barchart_Legend_title is in the part of Para---$$$$$$:')
# print('$$$Barchart_Legend_title:', Barchart_Legend_title)
####################
Barchart_Legend = []
####################
for i in df_Para_Grouped[Barchart_Legend_title].tolist():
if i not in Barchart_Legend:
Barchart_Legend.append(i)
# print('$$$Barchart_Legend:', Barchart_Legend)
###############################################################################
# 根据Config判断画哪种图
# print('$$$Config_Para:', Config_Para)
###############################################################################
for Config_Para_key in list(Config_Para.keys()):
###########################################################################
# 画Barchart类型(not byGroup)
if Config_Para_key == 'Barchart_Item':
##################
Barchart_Data = {}
##################
##########################################################
# 按Split对Barchart_Data进行分组, 注意与上面的Barchart_byGroup_Data的分组规则不同
for Config_Para_value in Config_Para[Config_Para_key]:
Barchart_Data.setdefault(Config_Para_value, {})
for i in Barchart_Legend:
index_Para = df_Para_Grouped[df_Para_Grouped[cols_Split_item] == i].index.tolist()
# print('$$$index_Para:', index_Para)
for j in index_Para:
Barchart_Data[Config_Para_value].setdefault(i, []).append(df_Para_Grouped[Config_Para_value][j])
##########################################################
# print('$$$Barchart_Data:', Barchart_Data)
################################################################################################
# Draw Map information
for key in list(Barchart_Data):
title_Para = ' Parameter=' + key + '\n' + key + ' Trend'
cols_Split_item_correct = cols_Split_item.replace('/', ' ')
picture_Para = cols_Split_item_correct + ' ' + key
length_Para = 1
Barchart_byGroup_Para = BarchartSinglePara(xlabel_Para, Barchart_Data[key], Barchart_Legend, title_Para, picture_Para, length_Para, ylabel_Para, Barchart_Legend_title)
Barchart_byGroup_Para.Bar_Para()
# break
print('Para有关数据处理并作图完毕!')
################################################################################################################
# Arg
################################################################################################################
elif input_flag == 'Arg':
print('正在处理Arg有关数据并作图, 请稍等...')
df_Arg = df_Input_dict['Arg']
df_Arg = df_Arg.dropna(axis=0, how='all')
# print('$$$df_Arg:', df_Arg.head())
# print('$$$df_Arg.Type:', df_Arg.Type)
# print('$$$df_Arg的列标签:', list(df_Arg))
########################################################
df_Split_copy = df_Split.copy()
df_Split_copy = df_Split_copy.fillna('None')
########################################################
Config_Arg = dict_Config['Sort_Arg']
########################################################
for cols_Split_item in cols_Split_items:
###############################################################################
index_list_Arg = df_Split_copy[cols_Split_item].tolist()
index_dict_Arg = {}
byGroup_list_Arg = []
###############################################################################
df_Arg.insert(2, cols_Split_item, df_Split_copy.pop(cols_Split_item))
###############################################################################
# print('$$$df_Arg:', df_Arg)
# df.groupby()返回的是一个对象类型(object), 不是DataFrame类型
###############################################################################
df_Arg_byGroup = df_Arg.groupby(cols_Split_item, as_index=False)
###############################################################################
# print('$$$df_Arg_byGroup:', df_Arg_byGroup)
###############################################################################
result_Arg = zip(*df_Arg_byGroup)
n, g = [list(i) for i in result_Arg]
###############################################################################
for name, group in df_Arg_byGroup:
# print('$$$name:', name)
# print(group)
index_dict_Arg[name] = index_list_Arg.index(name)
# print('$$$index_dict_Arg:', index_dict_Arg)
###############################################################################
v = list(index_dict_Arg.values())
# print('$$$v:', v)
df_Arg_byGroup_zipped = zip(n, g, v)
df_Arg_byGroup_sorted = sorted(df_Arg_byGroup_zipped, key=lambda x: x[2])
###############################################################################
for name, group, value in df_Arg_byGroup_sorted:
df_Arg_byGroup_temp = df_Arg_byGroup.get_group(name)
byGroup_list_Arg.append(df_Arg_byGroup_temp)
# 用pd.concat()方法把多个DataFrame拼接成一个
df_Arg_Grouped = pd.concat(byGroup_list_Arg)
# print('$$$df_Arg_Grouped:', df_Arg_Grouped)
###############################################################################
df_Arg.pop(cols_Split_item)
# print('$$$df_Arg_pop:', df_Arg)
###############################################################################
# 准备好legend_label
Split_list_Arg = df_Arg_Grouped[cols_Split_item].tolist()
# print('$$$Split_list_Arg:', Split_list_Arg)
Legend_label_Arg = []
for Split_item, Split_item_index in zip(Split_list_Arg, range(len(Split_list_Arg))):
if Split_list_Arg[Split_item_index] == 'None':
Split_item = ''
Type_ID_Arg = df_Arg_Grouped[list(df_Arg_Grouped)[0]].tolist()[Split_item_index]
Box_ID_Arg = df_Arg_Grouped[list(df_Arg_Grouped)[1]].tolist()[Split_item_index]
if len(str(Box_ID_Arg)) == 1:
Legend_label_Arg_tmp = Split_item + '::' + str(Type_ID_Arg) + '::B0' + str(Box_ID_Arg)
Legend_label_Arg.append(Legend_label_Arg_tmp)
else:
Legend_label_Arg_tmp = Split_item + '::' + str(Type_ID_Arg) + '::B' + str(Box_ID_Arg)
Legend_label_Arg.append(Legend_label_Arg_tmp)
# print('$$$Legend_label_Arg:', Legend_label_Arg)
###############################################################################
# 准备好xlabel
xlabel_Arg = list(df_Arg_Grouped)[3:]
###############################################################################
# 准备好ylabel
ylabel_Arg = 'Arg Ratio'
###############################################################################
# 准备好图例的标题Legend_title和图例Legend
Barchart_Legend_title = cols_Split_item
# print('$$$$$$---This Barchart_Legend_title is in the part of Arg---$$$$$$')
# print('$$$Barchart_Legend_title:', Barchart_Legend_title)
###############################################################################
# 字典Barchart_Legend的键为cols_Split_item的每一种group的名字
# 字典Barchart_Legend的值为每一种group对应的索引, 相同的group索引相同,
# 索引从0开始计, 每遇到一种不同的group, 索引值加1, 否则索引值不变
# Barchart_Legend_tmp为一个临时列表, 用完就丢弃
Barchart_Legend = {}
Barchart_Legend_tmp = []
###############################################################################
cols_Split_item_groups = df_Arg_Grouped[Barchart_Legend_title].tolist()
# print('$$$cols_Split_item_groups:', cols_Split_item_groups)
for i in cols_Split_item_groups:
if i not in Barchart_Legend_tmp:
Barchart_Legend_tmp.append(i)
for i in cols_Split_item_groups:
Barchart_Legend.setdefault(i, []).append(Barchart_Legend_tmp.index(i))
# print('$$$Barchart_Legend:', Barchart_Legend)
###############################################################################
###############################################################################
sum_groupsNums = 0
Barchart_Legend_groupsNums = []
for i in Barchart_Legend:
sum_groupsNums += cols_Split_item_groups.count(i)
Barchart_Legend_groupsNums.append(sum_groupsNums)
# print('$$$Barchart_Legend_groupsNums:', Barchart_Legend_groupsNums)
###############################################################################
###############################################################################
###############################################################################
# 根据Config判断画哪种图
# print('$$$Config_Arg:', Config_Arg)
##################################################
for Config_Arg_key in list(Config_Arg.keys()):
##############################################
# 画Barchart_byGroup类型
if Config_Arg_key == 'Barchart_byGroup_Item':
########################################
# 去掉df_Arg_Grouped的前三列(Type, Box, cols_Split_item)
Barchart_byGroup_Data = df_Arg_Grouped.drop(columns=list(df_Arg_Grouped)[0:3], inplace=False)
########################################
# print('$$$Barchart_byGroup_Data:', Barchart_byGroup_Data)
#############################
# Draw Map information
title_Arg = ' Arg Ratio by ' + cols_Split_item
cols_Split_item_correct = cols_Split_item.replace('/', ' ')
picture_Arg = cols_Split_item_correct + ' Arg Barchart'
# 计算Barchart_byGroup_Data每个column的长度, 即每个group中柱子的个数
# print('$$$list(Barchart_byGroup_Data):', list(Barchart_byGroup_Data))
length_Arg = len(Barchart_byGroup_Data[list(Barchart_byGroup_Data)[0]])
# print('$$$length_Arg:', length_Arg)
Barchart_byGroup_Arg = BarchartByGroupArg(xlabel_Arg, Barchart_byGroup_Data, Barchart_Legend, title_Arg, picture_Arg, length_Arg, ylabel_Arg, Barchart_Legend_title, Legend_label_Arg)
Barchart_byGroup_Arg.Bar_ByGroupArg()
##############################################
# 画Boxchart_byGroup类型
elif Config_Arg_key == 'Boxchart_byGroup_Item':
########################################
Boxchart_byGroup_Data = {}
########################################
# 去掉df_Arg_Grouped的前三列(Type, Box, cols_Split_item)
Boxchart_byGroup_Data_ref = df_Arg_Grouped.drop(columns=list(df_Arg_Grouped)[0:3], inplace=False)
########################################
# print('$$$Boxchart_byGroup_Data_ref:', Boxchart_byGroup_Data_ref)
########################################
for i in list(Boxchart_byGroup_Data_ref):
cut_index_groupsNum = 0
for Barchart_Legend_groupsNum in Barchart_Legend_groupsNums:
if Barchart_Legend_groupsNum == len(cols_Split_item_groups):
Boxchart_byGroup_Data_trans = Boxchart_byGroup_Data_ref[i].tolist()
data_format_exchange(Boxchart_byGroup_Data_trans)
###################################################################
###################################################################
# 判断用data_format_exchange函数转化之前的对象是否为字符串:1表示是, 0表示否
each_Bbdts_flag = 0
for each_Bbdts in Boxchart_byGroup_Data_trans:
if each_Bbdts > 1:
each_Bbdts_flag = 1
break
if each_Bbdts_flag == 0:
Boxchart_byGroup_Data_trans1 = []
for each_Bbdts in Boxchart_byGroup_Data_trans:
each_Bbdts = each_Bbdts * 100
Boxchart_byGroup_Data_trans1.append(each_Bbdts)
Boxchart_byGroup_Data_trans = Boxchart_byGroup_Data_trans1
###################################################################
###################################################################
Boxchart_byGroup_Data.setdefault(i, []).append(Boxchart_byGroup_Data_trans[cut_index_groupsNum:])
else:
Boxchart_byGroup_Data_trans = Boxchart_byGroup_Data_ref[i].tolist()
data_format_exchange(Boxchart_byGroup_Data_trans)
###################################################################
###################################################################
# 判断用data_format_exchange函数转化之前的对象是否为字符串:1表示是, 0表示否
each_Bbdts_flag = 0
for each_Bbdts in Boxchart_byGroup_Data_trans:
if each_Bbdts > 1:
each_Bbdts_flag = 1
break
if each_Bbdts_flag == 0:
Boxchart_byGroup_Data_trans1 = []
for each_Bbdts in Boxchart_byGroup_Data_trans:
each_Bbdts = each_Bbdts * 100
Boxchart_byGroup_Data_trans1.append(each_Bbdts)
Boxchart_byGroup_Data_trans = Boxchart_byGroup_Data_trans1
###################################################################
###################################################################
Boxchart_byGroup_Data.setdefault(i, []).append(Boxchart_byGroup_Data_trans[cut_index_groupsNum:Barchart_Legend_groupsNum])
cut_index_groupsNum = Barchart_Legend_groupsNum
# print('$$$Boxchart_byGroup_Data:', Boxchart_byGroup_Data)
#############################
# Draw Map information
title_Arg = ' Arg Ratio by ' + cols_Split_item
cols_Split_item_correct = cols_Split_item.replace('/', ' ')
picture_Arg = cols_Split_item_correct + ' Arg Boxchart'
# 计算Boxchart中每个group中箱型图的个数
length_Arg = len(Barchart_Legend)
# print('$$$length_Arg:', length_Arg)
Boxchart_byGroup_Arg = BarchartByGroupArg(xlabel_Arg, Boxchart_byGroup_Data, Barchart_Legend, title_Arg, picture_Arg, length_Arg, ylabel_Arg, Barchart_Legend_title, Legend_label_Arg)
Boxchart_byGroup_Arg.Box_ByGroupArg()
# break
print('Arg有关数据处理并作图完毕!')
################################################################################################################
# Argc
################################################################################################################
elif input_flag == 'Argc':
print('正在处理Argc有关数据并作图, 请稍等...')
df_Argc = df_Input_dict['Argc']
df_Argc = df_Argc.dropna(axis=0, how='all')
# print('$$$df_Argc:', df_Argc.head())
# print('$$$df_Argc.Type:', df_Argc.Type)
# print('$$$df_Argc的列标签:', list(df_Argc))
########################################################
df_Split_copy = df_Split.copy()
df_Split_copy = df_Split_copy.fillna('None')
########################################################
Config_Argc = dict_Config['Sort_Argc']
########################################################
for cols_Split_item in cols_Split_items:
###############################################################################
index_list_Argc = df_Split_copy[cols_Split_item].tolist()
index_dict_Argc = {}
byGroup_list_Argc = []
###############################################################################
df_Argc.insert(2, cols_Split_item, df_Split_copy.pop(cols_Split_item))
###############################################################################
# print('$$$df_Argc:', df_Argc)
# df.groupby()返回的是一个对象类型(object), 不是DataFrame类型
###############################################################################
df_Argc_byGroup = df_Argc.groupby(cols_Split_item, as_index=False)
###############################################################################
# print('$$$df_Argc_byGroup:', df_Argc_byGroup)
###############################################################################
result_Argc = zip(*df_Argc_byGroup)
n, g = [list(i) for i in result_Argc]
###############################################################################
for name, group in df_Argc_byGroup:
# print('$$$name:', name)
# print(group)
index_dict_Argc[name] = index_list_Argc.index(name)
# print('$$$index_dict_Argc:', index_dict_Argc)
###############################################################################
v = list(index_dict_Argc.values())
# print('$$$v:', v)
df_Argc_byGroup_zipped = zip(n, g, v)
df_Argc_byGroup_sorted = sorted(df_Argc_byGroup_zipped, key=lambda x: x[2])
###############################################################################
for name, group, value in df_Argc_byGroup_sorted:
df_Argc_byGroup_temp = df_Argc_byGroup.get_group(name)
byGroup_list_Argc.append(df_Argc_byGroup_temp)
# 用pd.concat()方法把多个DataFrame拼接成一个
df_Argc_Grouped = pd.concat(byGroup_list_Argc)
# print('$$$df_Argc_Grouped:', df_Argc_Grouped)
###############################################################################
df_Argc.pop(cols_Split_item)
# print('$$$df_Argc_pop:', df_Argc)
###############################################################################
# 准备好legend_label
Split_list_Argc = df_Argc_Grouped[cols_Split_item].tolist()
# print('$$$Split_list_Argc:', Split_list_Argc)
Legend_label_Argc = []
for Split_item, Split_item_index in zip(Split_list_Argc, range(len(Split_list_Argc))):
if Split_list_Argc[Split_item_index] == 'None':
Split_item = ''
Type_ID_Argc = df_Argc_Grouped[list(df_Argc_Grouped)[0]].tolist()[Split_item_index]
Box_ID_Argc = df_Argc_Grouped[list(df_Argc_Grouped)[1]].tolist()[Split_item_index]
if len(str(Box_ID_Argc)) == 1:
Legend_label_Argc_tmp = Split_item + '::' + str(Type_ID_Argc) + '::B0' + str(Box_ID_Argc)
Legend_label_Argc.append(Legend_label_Argc_tmp)
else:
Legend_label_Argc_tmp = Split_item + '::' + str(Type_ID_Argc) + '::B' + str(Box_ID_Argc)
Legend_label_Argc.append(Legend_label_Argc_tmp)
# print('$$$Legend_label_Argc:', Legend_label_Argc)
###############################################################################
# 准备好xlabel
xlabel_Argc = list(df_Argc_Grouped)[3:]
###############################################################################
# 准备好ylabel
ylabel_Argc = 'Arg Count'
###############################################################################
# 准备好图例的标题Legend_title和图例Legend
Barchart_Legend_title = cols_Split_item
# print('$$$$$$---This Barchart_Legend_title is in the part of Argc---$$$$$$')
# print('$$$Barchart_Legend_title:', Barchart_Legend_title)
###############################################################################
# 字典Barchart_Legend的键为cols_Split_item的每一种group的名字
# 字典Barchart_Legend的值为每一种group对应的索引, 相同的group索引相同,
# 索引从0开始计, 每遇到一种不同的group, 索引值加1, 否则索引值不变
# Barchart_Legend_tmp为一个临时列表, 用完就丢弃
Barchart_Legend = {}
Barchart_Legend_tmp = []
###############################################################################
cols_Split_item_groups = df_Argc_Grouped[Barchart_Legend_title].tolist()
# print('$$$cols_Split_item_groups:', cols_Split_item_groups)
for i in cols_Split_item_groups:
if i not in Barchart_Legend_tmp:
Barchart_Legend_tmp.append(i)
for i in cols_Split_item_groups:
Barchart_Legend.setdefault(i, []).append(Barchart_Legend_tmp.index(i))
# print('$$$Barchart_Legend:', Barchart_Legend)
###############################################################################
###############################################################################
sum_groupsNums = 0
Barchart_Legend_groupsNums = []
for i in Barchart_Legend:
sum_groupsNums += cols_Split_item_groups.count(i)
Barchart_Legend_groupsNums.append(sum_groupsNums)
# print('$$$Barchart_Legend_groupsNums:', Barchart_Legend_groupsNums)
###############################################################################
###############################################################################
###############################################################################
# 根据Config判断画哪种图
# print('$$$Config_Argc:', Config_Argc)
##################################################
for Config_Argc_key in list(Config_Argc.keys()):
##############################################
# 画Barchart_byGroup类型
if Config_Argc_key == 'Barchart_byGroup_Item':
########################################
# 去掉df_Argc_Grouped的前三列(Type, Box, cols_Split_item)
Barchart_byGroup_Data = df_Argc_Grouped.drop(columns=list(df_Argc_Grouped)[0:3], inplace=False)
########################################
# print('$$$Barchart_byGroup_Data:', Barchart_byGroup_Data)
# print('$$$list(Barchart_byGroup_Data.index):', list(Barchart_byGroup_Data.index))
#############################
# Draw Map information
title_Argc = ' Arg Count by ' + cols_Split_item
cols_Split_item_correct = cols_Split_item.replace('/', ' ')
picture_Argc = cols_Split_item_correct + ' Argc Barchart'
# 计算Barchart_byGroup_Data每个column的长度, 即每个group中柱子的个数
# print('$$$list(Barchart_byGroup_Data):', list(Barchart_byGroup_Data))
length_Argc = len(Barchart_byGroup_Data[list(Barchart_byGroup_Data)[0]])
# print('$$$length_Argc:', length_Argc)
Barchart_byGroup_Argc = BarchartByGroupArgc(xlabel_Argc, Barchart_byGroup_Data, Barchart_Legend, title_Argc, picture_Argc, length_Argc, ylabel_Argc, Barchart_Legend_title, Legend_label_Argc)
Barchart_byGroup_Argc.Bar_ByGroupArgc()
##############################################
# 画Boxchart_byGroup类型
elif Config_Argc_key == 'Boxchart_byGroup_Item':
########################################
Boxchart_byGroup_Data = {}
########################################
# 去掉df_Argc_Grouped的前三列(Type, Box, cols_Split_item)
Boxchart_byGroup_Data_ref = df_Argc_Grouped.drop(columns=list(df_Argc_Grouped)[0:3], inplace=False)
########################################
# print('$$$Boxchart_byGroup_Data_ref:', Boxchart_byGroup_Data_ref)
########################################
for i in list(Boxchart_byGroup_Data_ref):
cut_index_groupsNum = 0
for Barchart_Legend_groupsNum in Barchart_Legend_groupsNums:
if Barchart_Legend_groupsNum == len(cols_Split_item_groups):
Boxchart_byGroup_Data_trans = Boxchart_byGroup_Data_ref[i].tolist()
data_format_exchange(Boxchart_byGroup_Data_trans)
Boxchart_byGroup_Data.setdefault(i, []).append(Boxchart_byGroup_Data_trans[cut_index_groupsNum:])
else:
Boxchart_byGroup_Data_trans = Boxchart_byGroup_Data_ref[i].tolist()
data_format_exchange(Boxchart_byGroup_Data_trans)
Boxchart_byGroup_Data.setdefault(i, []).append(Boxchart_byGroup_Data_trans[cut_index_groupsNum:Barchart_Legend_groupsNum])
cut_index_groupsNum = Barchart_Legend_groupsNum
# print('$$$Boxchart_byGroup_Data:', Boxchart_byGroup_Data)
#############################
# Draw Map information
title_Argc = ' Arg Count by ' + cols_Split_item
cols_Split_item_correct = cols_Split_item.replace('/', ' ')
picture_Argc = cols_Split_item_correct + ' Argc Boxchart'
# 计算Boxchart中每个group中箱型图的个数
length_Argc = len(Barchart_Legend)
# print('$$$length_Argc:', length_Argc)
Boxchart_byGroup_Argc = BarchartByGroupArgc(xlabel_Argc, Boxchart_byGroup_Data, Barchart_Legend, title_Argc, picture_Argc, length_Argc, ylabel_Argc, Barchart_Legend_title, Legend_label_Argc)
Boxchart_byGroup_Argc.Box_ByGroupArgc()
# break
print('Argc有关数据处理并作图完毕!')
五、需要注意的点
1、由于绘图的量比较大,容易导致内存溢出,所以采取绘制一种类型的图片,就清一下内存。
代码如下:
plt.clf()
plt.close(self.fig)
六、运行结果:
1、sheet名为Gar的数据绘制的图片类型
(1)
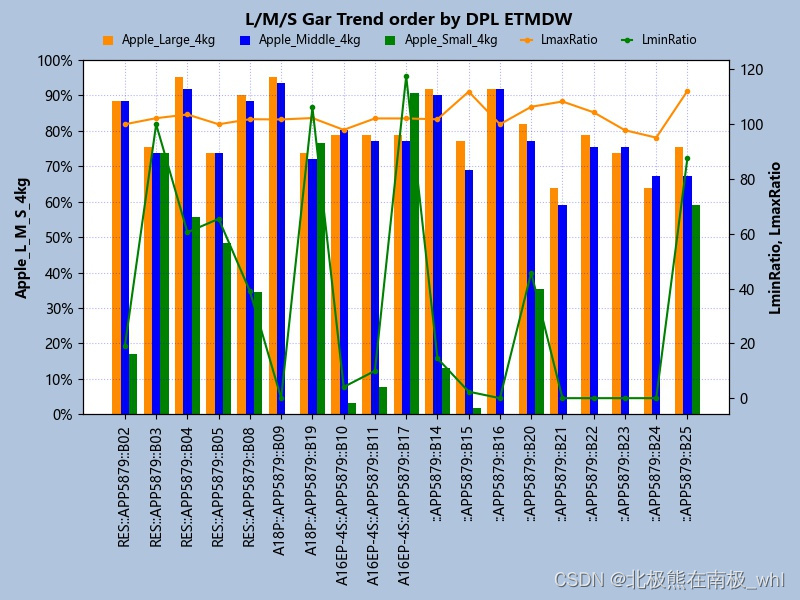
(2)
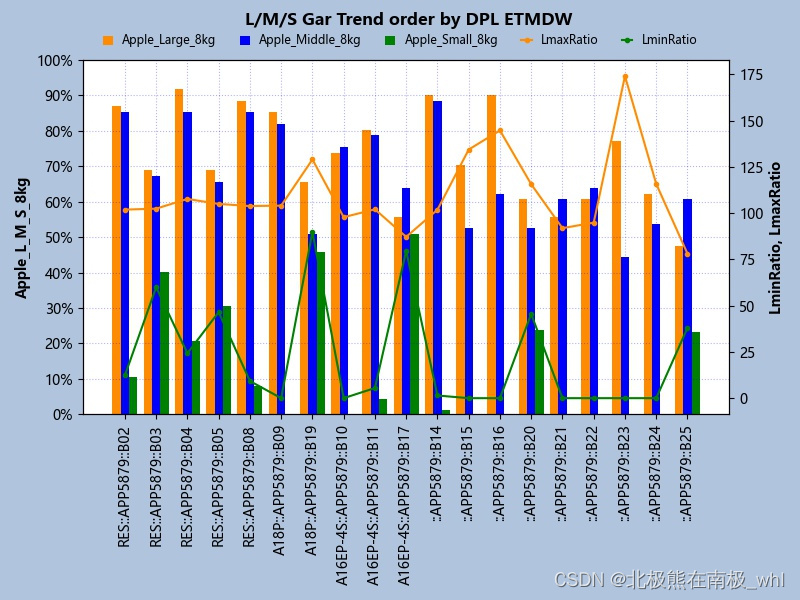
(3)
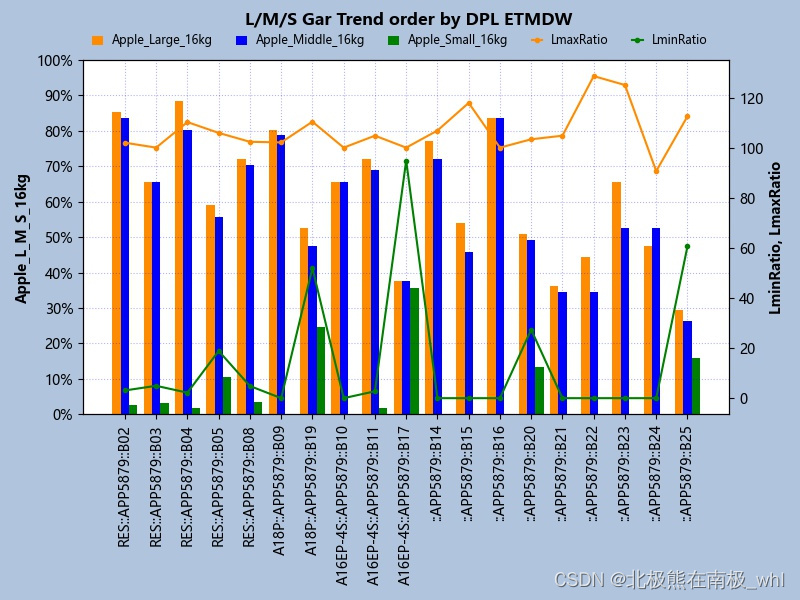
2、sheet名为Ban的数据绘制的图片类型
(1)
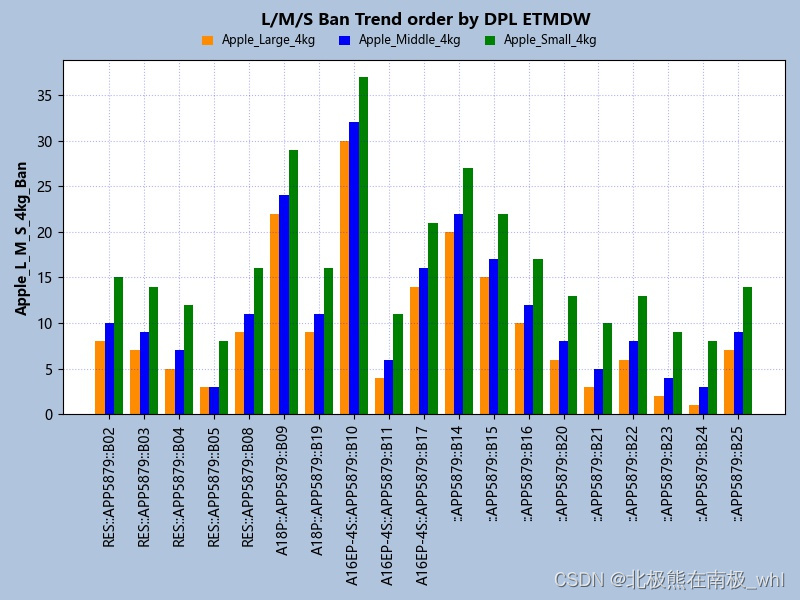
(2)

(3)
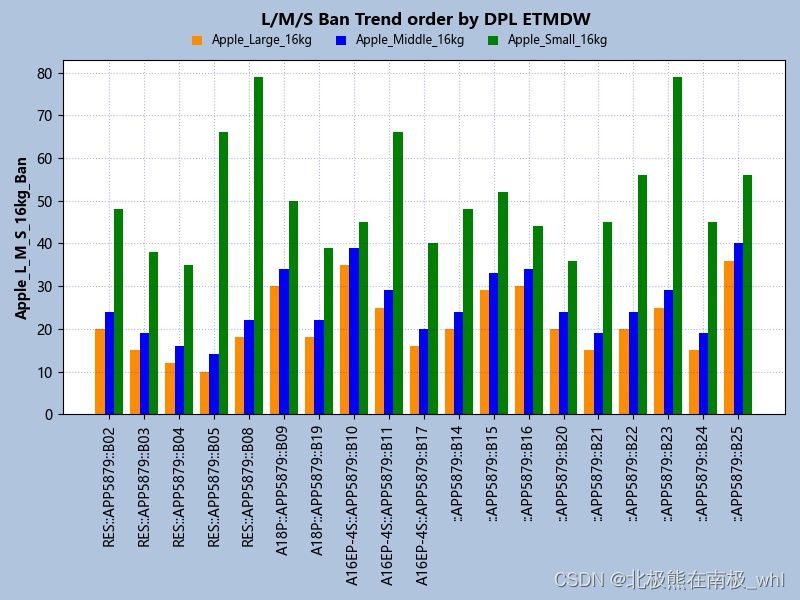
3、sheet名为Para的数据绘制的图片类型
(1)
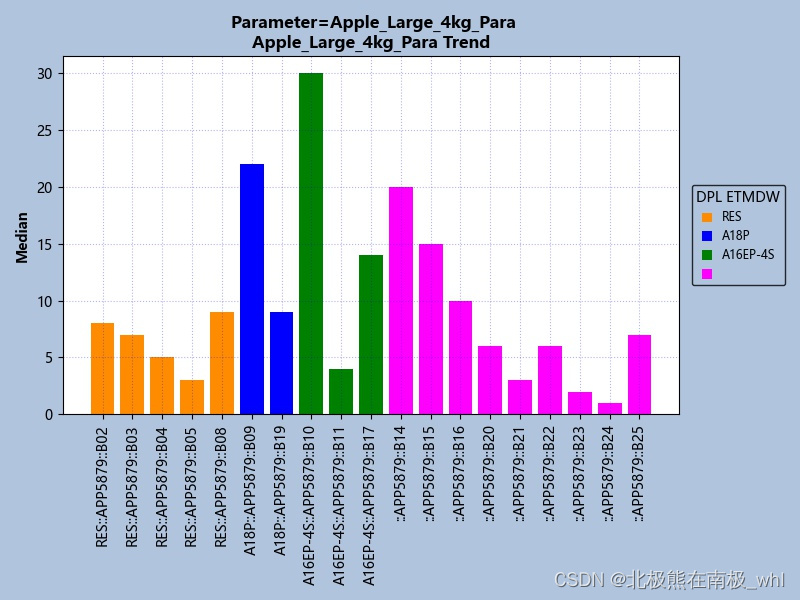
(2)
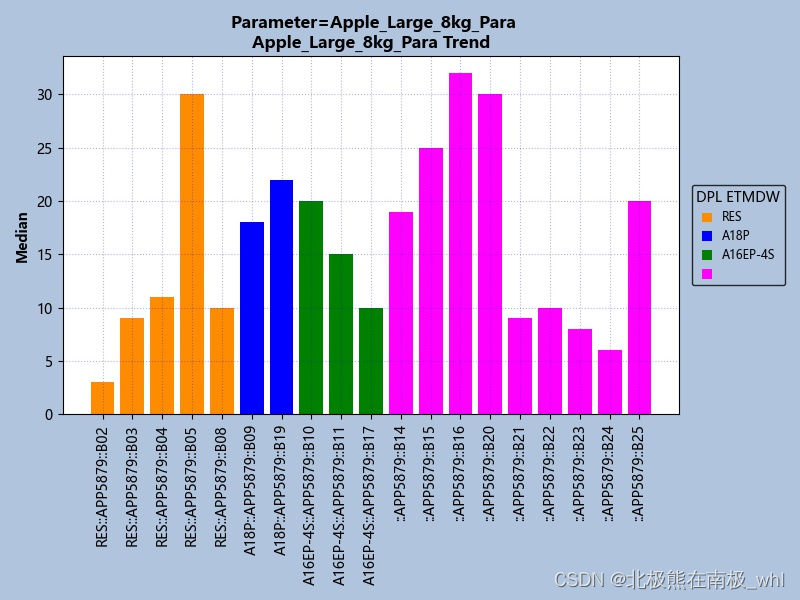
(3)
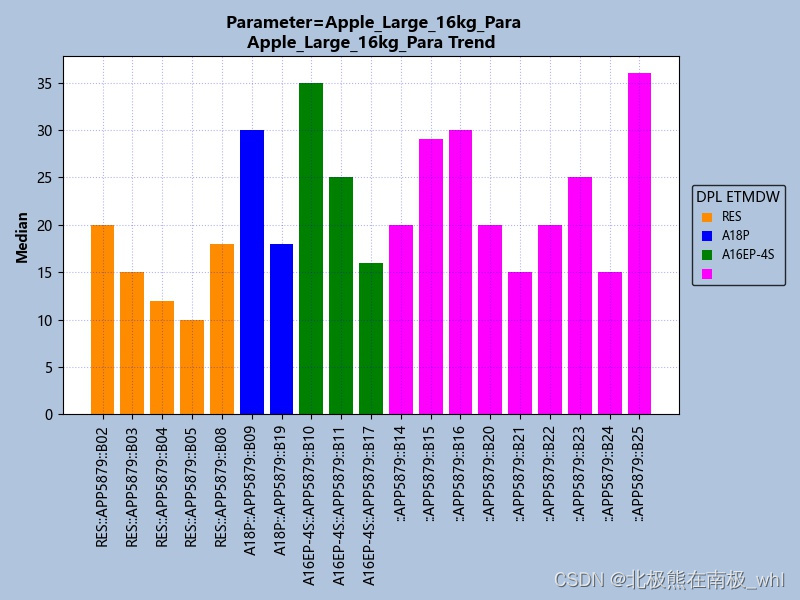
4、sheet名为Arg的数据绘制的图片类型
(1)
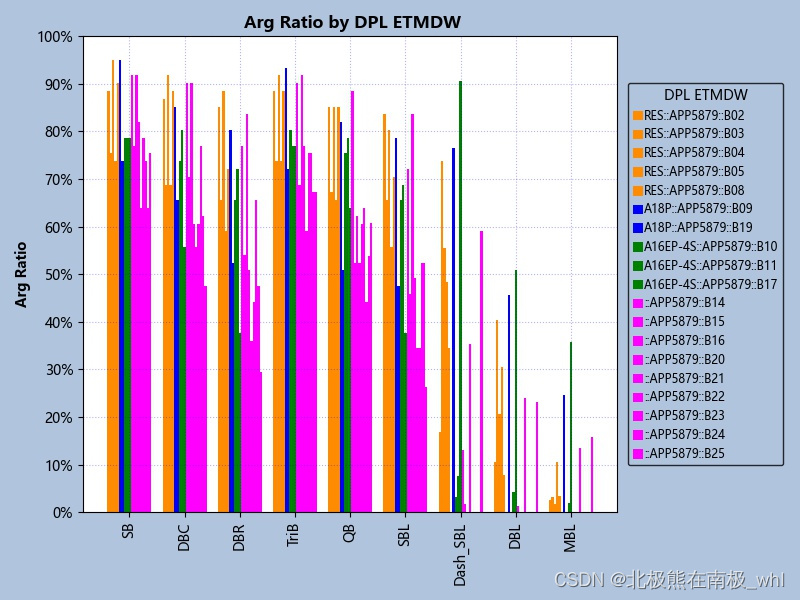
(2)
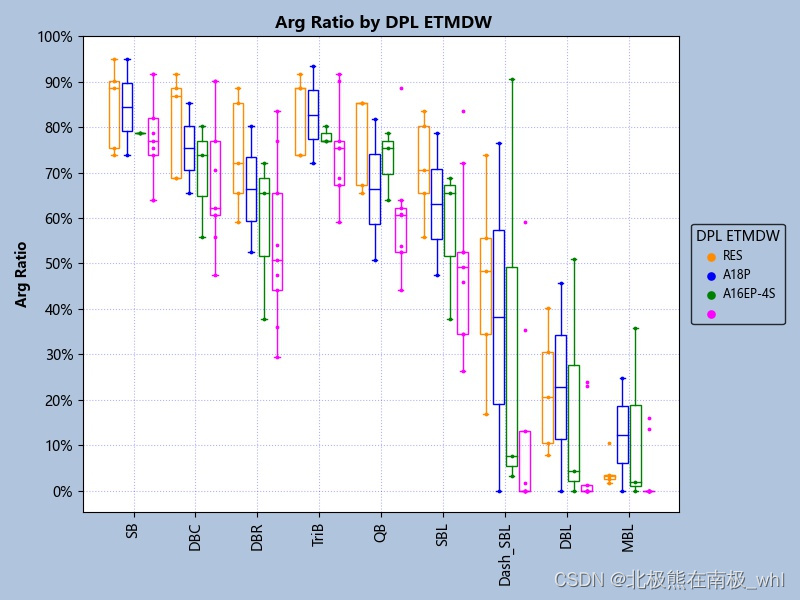
5、sheet名为Argc的数据绘制的图片类型
(1)

(2)
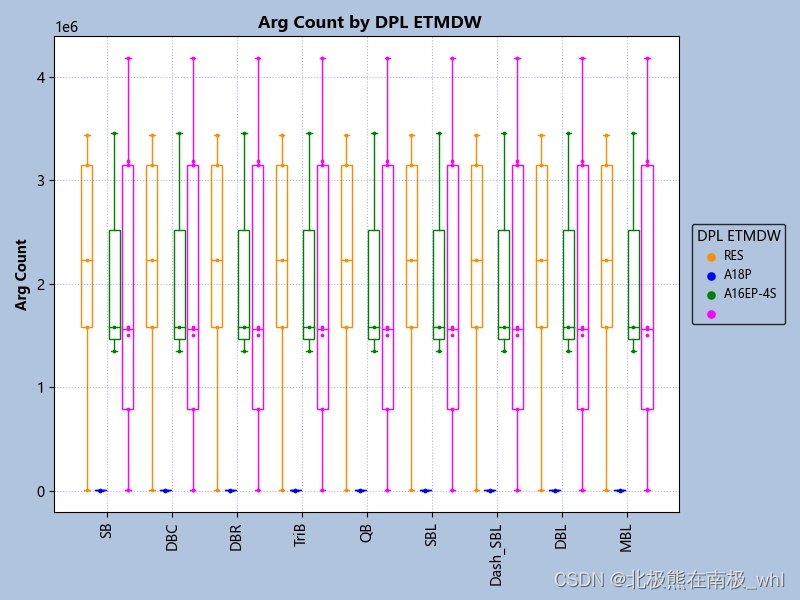
七、总结
以上就是今天要讲的内容,本文的总体脚本量在1400+,详细介绍了如何利用pandas、matplotlib、re、glob、列表、字典、类与继承等模块和内容,批量绘制【分组柱状图】、【双轴分组柱状图】、【分组箱线图】、【分组散点图和分组箱线图叠加图】等类型的图片,从而实现自动化办公的一个项目的简单实现。


 1101
1101


 被折叠的 条评论
为什么被折叠?
被折叠的 条评论
为什么被折叠?
 到【灌水乐园】发言


