


fir,sec,thi,fou,fif
style="width:100%;"
style="height:450px;"
style="margin:20px auto;"  //顶部间隔左右居中
style="margin: 5px 0 0 0"  //上右下左
style="border:1px solid red;"  //顶部边框颜色
style="border-top:1px solid red;" //顶部边框颜色
background: #fff;  //背景颜色
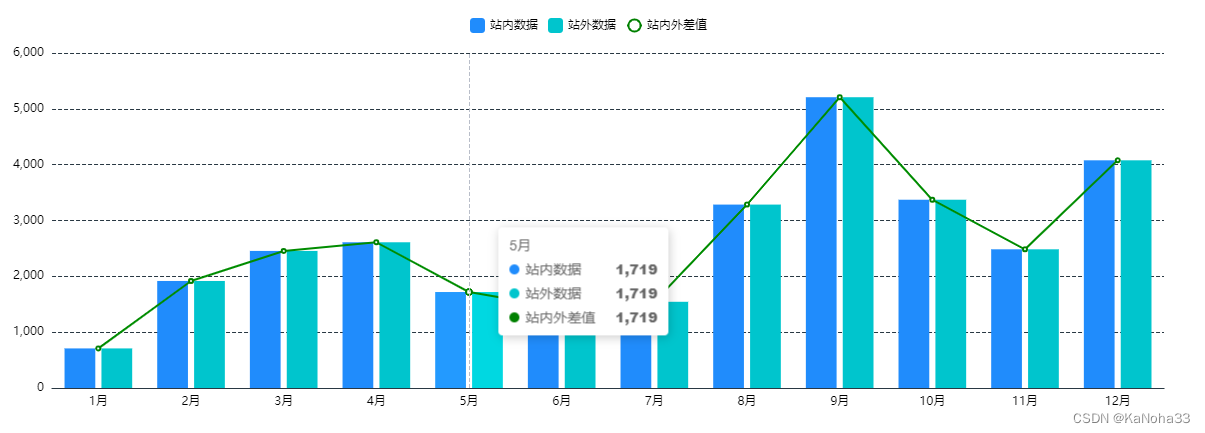
并排柱状图+折线图
<div id="barChartDiv" style="margin:20px auto;width:100%;height:450px;border-top:1px solid black;">
      <!--存放柱状图的card容器-->
      <el-row >
        <el-col :span="18" style="margin: 5px 0 0 0">
          <div style="width:95%;height:400px;"  class="chart-container" >
            <!--            存放柱状图的div-->
            <div id="myBarChart"></div>
          </div>
        </el-col>
      </el-row>
    </div>
<style lang="scss" scoped>
.chart-container {
padding: 10px;
background: #fff;
#myBarChart { //图表div
margin: 0 auto;
width: 100%;
height: 100%;
}
}
</style>//渲染时生成图表
mounted() {
this.$nextTick(function () {
this.loadList();
this.drawBarData("myBarChart");
});
},//查询图表数据
loadList(){
this.$post("/opms/manage/eqMeasurement/msFlowmeterTest/selectLaboratoryData",this.queryCondition, (data) => {
this.tableData = data.data.tableData
this.drawBarData("myBarChart",data.data.xAxisList,data.data.firDataList,data.data.secDataList,data.data.thiDataList);
},()=>{
});
},drawBarData(myBarChart,xAxisList,firDataList,secDataList,thiDataList){
console.log(xAxisList)
this.myCharLine = this.$echarts.init(document.getElementById(myBarChart));
this.myCharLine.setOption({
legend: {
data:['站内数据','站外数据','站内外差值'],
show: true,
top: 0,
itemWidth: 15,
itemHeight: 15,
textStyle: {
color: '#000',
},
},
tooltip: { //axis显示当前列的所有信息,item显示当前节点信息
trigger: 'axis'
},
grid: {
containLabel: true,
top: 40,
left: 5,
right: 5,
bottom: 5,
width: 'auto', //图例宽度
},
xAxis: {
// 坐标轴刻度
//data: xAxisList,
data: ['1月', '2月', '3月', '4月', '5月', '6月', '7月', '8月', '9月', '10月', '11月', '12月'],
axisTick: {
show: false,
},
axisLine: {
show: true, //
lineStyle: {
color: '#293843', // x轴线颜色
},
},
axisLabel: {
textStyle: {
color: '#000',
},
align: 'center',
},
},
yAxis: {
type: 'value',
splitLine: {
lineStyle: {
type: 'dashed',
color: '#293843',
},
},
axisLabel: {
textStyle: {
color: '#000',
},
},
},
series: [
{
//data:firDataList,
data: [709, 1917, 2455, 2610, 1719, 1433, 1544, 3285, 5208, 3372, 2484, 4078],
name: '站内数据',
color: '#208CFC',//蓝色
type: 'bar',
},
{
//data:secDataList,
data: [709, 1917, 2455, 2610, 1719, 1433, 1544, 3285, 5208, 3372, 2484, 4078],
name: '站外数据',
color: '#00C5CD',//青绿
type: 'bar',
},
{
//data:thiDataList,
data: [709, 1917, 2455, 2610, 1719, 1433, 1544, 3285, 5208, 3372, 2484, 4078],
name: '站内外差值',
color: 'green',
type: 'line',
},
],
});
},上下柱状图+折线图:


 1万+
1万+


 被折叠的 条评论
为什么被折叠?
被折叠的 条评论
为什么被折叠?
 到【灌水乐园】发言


