


本文案例来自《Python编程:从入门到实践》,章节16.2,绘制世界人口地图。
代码中包含两个模块:world_population.py和country_codes.py。pygal中的world()方法对绘制地图提供了很大方便。population_data.json文件下载地址:点击打开链接
world_population.py
import json
import pygal.maps.world
from country_codes import get_country_code
from pygal.style import RotateStyle
from pygal.style import LightColorizedStyle as LCS, RotateStyle as RS
# 将数据加载到一个列表中
filename = 'population_data.json'
with open(filename) as f:
pop_data = json.load(f)
# 打印每个国家2010年的人口数量
cc_populations = {}
for pop_dict in pop_data:
if pop_dict['Year'] == '2010':
country_name = pop_dict['Country Name']
population = int(float(pop_dict['Value']))
code = get_country_code(country_name)
if code:
cc_populations[code] = population
# 根据人口把国家分成3类
cc_pops_1,cc_pops_2,cc_pops_3 = {},{},{}
for cc,pop in cc_populations.items():
if pop < 10000000:
cc_pops_1[cc] = pop
elif pop < 1000000000:
cc_pops_2[cc] = pop
else:
cc_pops_3[cc] = pop
# 看看每组都包含多少个国家
print(len(cc_pops_1), len(cc_pops_2), len(cc_pops_3))
wm_style = RS('#336699',base_style=LCS)
wm = pygal.maps.world.World(style=wm_style)
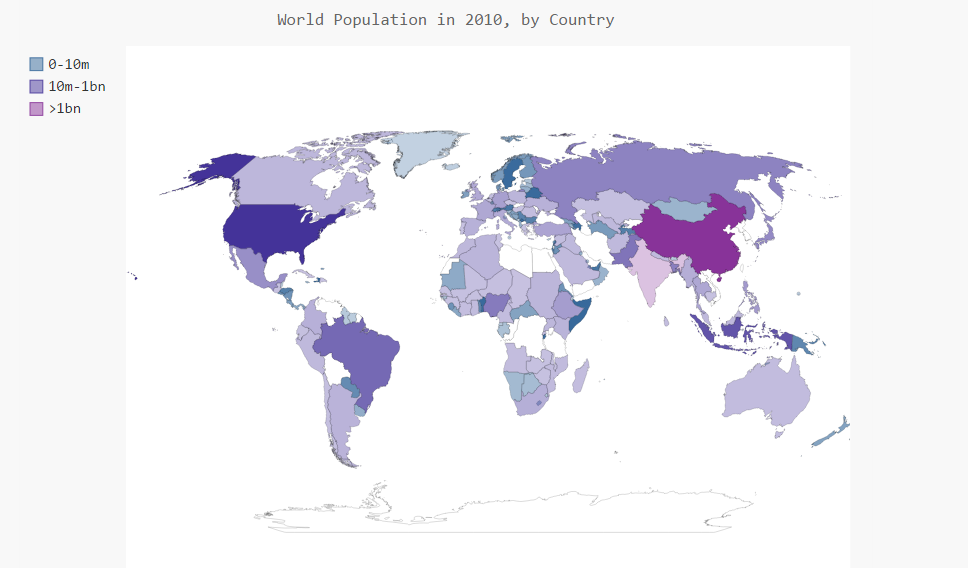
wm.title = ('World Population in 2010, by Country')
wm.add('0-10m', cc_pops_1)
wm.add('10m-1bn', cc_pops_2)
wm.add('>1bn', cc_pops_3)
wm.render_to_file('world_population.svg')
from pygal.maps.world import COUNTRIES

def get_country_code(country_name):
	"""根据指定的国家名,返回Pygal使用的两个字母的国别码"""
	for code,name in COUNTRIES.items():
		if name == country_name:
			return code

	# 如果没有找到指定的国家,就返回None
	return None
展示效果如下:


 8万+
8万+

 被折叠的 条评论
为什么被折叠?
被折叠的 条评论
为什么被折叠?
 到【灌水乐园】发言


