


 这篇博客介绍了如何使用Python的mpl_toolkits.basemap库结合shapefile来在地图上添加详细的地图信息。内容包括如何绘制多边形边界、读取点数据并绘制、以及填充多边形。示例代码展示了如何根据shapefile中的属性选择特定的几何元素进行绘制,例如在地图上标记雷暴中的闪电位置。此外,还讲解了如何填充多边形以突出显示特定区域,如地图上的'Selva'区域。
译注:绘制地图时因为一些原因可能需要使用shapefile添加地图信息,比如很多软件中的关于中国的地图信息都不是很准确,当要明确标注中国边界信息时就会出问题。这次就介绍一下如何利用shp文件添加地图信息。
基本用法:
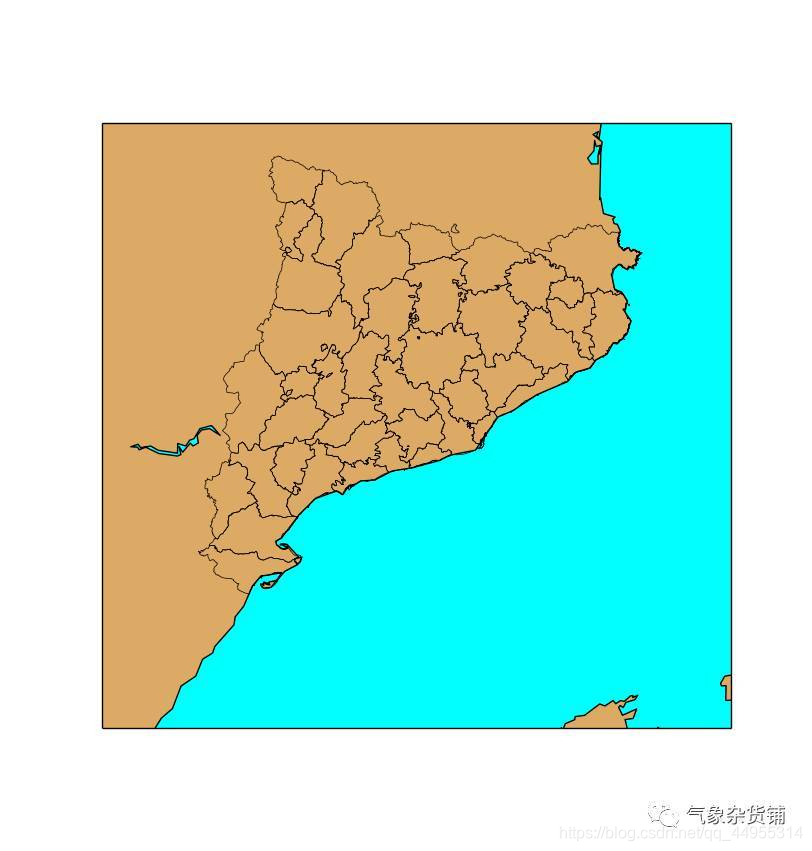
首先用一种最简单的方式绘制 shapefile
from mpl_toolkits.basemap import Basemap
import matplotlib.pyplot as plt

map = Basemap(llcrnrlon=-0.5,llcrnrlat=39.8,urcrnrlon=4.,urcrnrlat=43.,
             resolution='i', projection='tmerc', lat_0 = 39.5, lon_0 = 1)

map.drawmapboundary(fill_color='aqua')
map.fillcontinents(color='#ddaa66',lake_color='aqua')
map.drawcoastlines()

map.readshapefile('../sample_files/comarques', 'comarques')

plt.show()
- 第一个参数为 shapefile 文件名,而且不应含有扩展名,因为Basemap假设给定名的 shapefile 文件,其 shp,sbf, shx文件均存在
- 第二个参数为之后 Basemap实例要从shapefile文件中获取的信息名称
当然这些存在一些约束:
注意:
- 文件必须是 EPSG:4326 或 经纬度坐标。如果不是,可以使用 ogr2ogr 进行转换
- 元素必须只有2维
- 此例只有在元素是 polygons 或 polylines 时有效
如图所示,结果仅是 polygons(polylines)的边界。如果要填充 polygons,可看后面的 填充 polygons 部分。
读取点数据
绘制点要复杂一些。首先,要读取 shapefile,然后使用 scatter, plot 或 matplotlib 函数进行绘制。
from mpl_toolkits.basemap import Basemap
import matplotlib.pyplot as plt

map = Basemap(llcrnrlon=-0.5,llcrnrlat=39.8,urcrnrlon=4.,urcrnrlat=43.,
             resolution='i', projection='tmerc', lat_0 = 39.5, lon_0 = 1)

map.drawmapboundary(fill_color='aqua')
map.fillcontinents(color='#ddaa66',lake_color='aqua')
map.drawcoastlines()

map.readshapefile('../sample_files/comarques', 'comarques')

lightning_info = map.readshapefile('../sample_files/lightnings', 'lightnings')

print lightning_info

for info, lightning in zip(map.lightnings_info, map.lightnings):
    if float(info['amplitude']) < 0:
        marker = '_'
    else:
        marker = '+'
    map.plot(lightning[0], lightning[1], marker=marker, color='m', markersize=8, markeredgewidth=2)

plt.show()
例子显示了一次雷暴过程中Catalonia 发生的闪电位置。
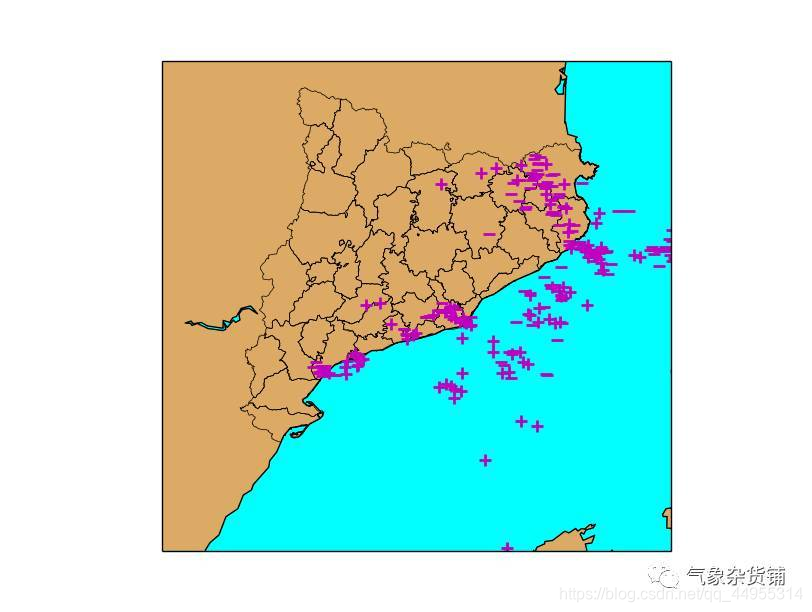
- 第二个参数名为 lightnings ,而且是 Basemap 实例映射,因此可以使用 map.lightning 获取shapefile文件中的几何元素,map.lightning_info 获取元素fields
- shapefile 方法返回元素序列,几何类型代码 1 及 边界范围
- 17行表示如何迭代所有元素
– zip 将每一个 geometry 和对应的 field value 联结到一起
– 当迭代字典时,使用 for 循环可以迭代每一个元素 - 此例中, 域名 amplitude 可用于判断闪电是正还是负,从而确定符号
- 使用 plot 绘制点时,使用 marker属性改变符号
多边形信息
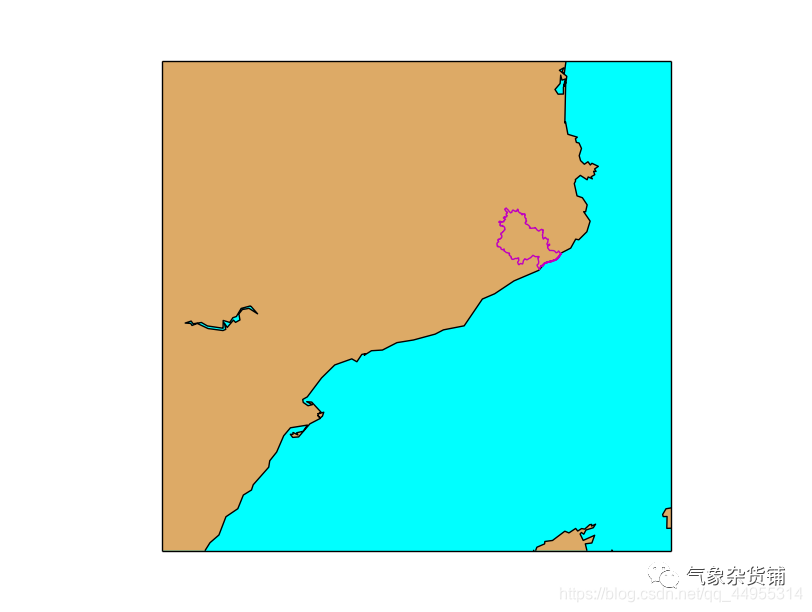
此例展示了如何使用 shapefile 属性选择一些 geometries
from mpl_toolkits.basemap import Basemap
import matplotlib.pyplot as plt

map = Basemap(llcrnrlon=-0.5,llcrnrlat=39.8,urcrnrlon=4.,urcrnrlat=43.,
             resolution='i', projection='tmerc', lat_0 = 39.5, lon_0 = 1)

map.drawmapboundary(fill_color='aqua')
map.fillcontinents(color='#ddaa66',lake_color='aqua')
map.drawcoastlines()

map.readshapefile('../sample_files/comarques', 'comarques', drawbounds = False)

for info, shape in zip(map.comarques_info, map.comarques):
    if info['nombre'] == 'Selva':
        x, y = zip(*shape)
        map.plot(x, y, marker=None,color='m')
plt.show()
- 如果要迭代所有元素,使用上例中的 zip
- 使用 nombre 域名进行过滤,这里也仅选择值为 Selva
- 要绘制线的话, x 和 y必须为单独的数组,但 geometry 通常是成对的点。如何实现分离可以看这里:
http://stackoverflow.com/questions/13635032/what-is-the-inverse-function-of-zip-in-python’ - 使用 plot 方法绘制,去除 marker 即可获得一条线
填充多边形
基本的绘制并不会填充多边形,下面介绍以下如何绘制填充多边形:
from mpl_toolkits.basemap import Basemap
import matplotlib.pyplot as plt
from matplotlib.patches import Polygon
from matplotlib.collections import PatchCollection
from matplotlib.patches import PathPatch
import numpy as np

fig     = plt.figure()
ax      = fig.add_subplot(111)

map = Basemap(llcrnrlon=-0.5,llcrnrlat=39.8,urcrnrlon=4.,urcrnrlat=43.,
             resolution='i', projection='tmerc', lat_0 = 39.5, lon_0 = 1)

map.drawmapboundary(fill_color='aqua')
map.fillcontinents(color='#ddaa66',lake_color='aqua')
map.drawcoastlines()

map.readshapefile('../sample_files/comarques', 'comarques', drawbounds = False)

patches   = []

for info, shape in zip(map.comarques_info, map.comarques):
    if info['nombre'] == 'Selva':
        patches.append( Polygon(np.array(shape), True) )

ax.add_collection(PatchCollection(patches, facecolor= 'm', edgecolor='k', linewidths=1., zorder=2))

plt.show()
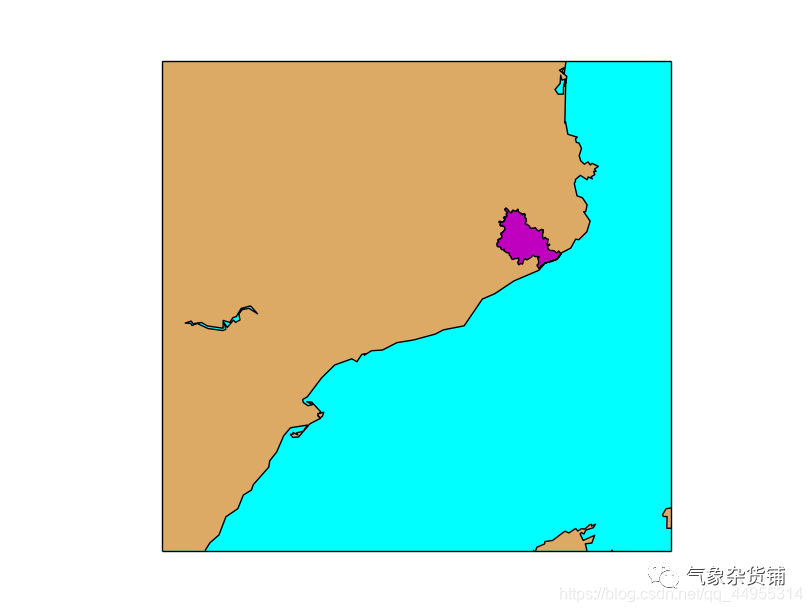
- matplotlib 使用一个名为 PatchCollection 的类用于设置填充多边形
- 此例中,形状为 Polygon。要创建它的话,坐标必须为 numpy 数组。第二个参数设置多边形为闭合。
http://shapelib.maptools.org/shp_api.html
http://stackoverflow.com/questions/15968762/shapefile-and-matplotlib-plot-polygon-collection-of-shapefile-coordinates ↩︎


 489
489

 被折叠的 条评论
为什么被折叠?
被折叠的 条评论
为什么被折叠?
 到【灌水乐园】发言


