


本文介绍multi-class分类任务中的模型评估指标及其使用Python的实现方式(包括使用sklearn进行实现,以及使用原生Python函数进行实现的操作)。
本文使用的示例是在英文多标签文本分类数据集AAPD数据集上,使用fastText包运算得到的多标签分类结果,与真实标签之间计算对应的指标结果(原则上使用one-label标签应该也能这么算,我就不另写了)。本文第一节将介绍相应数据的处理方式,第二节及其后是各指标的原理和计算方式。
fastText的使用方式可参考我之前写的博文:fastText Python 教程_诸神缄默不语的博客-CSDN博客_python 安装fasttext
文章目录
1. 数据获取、模型运算与结果的储存和加载
数据下载地址:https://git.uwaterloo.ca/jimmylin/hedwig-data/-/tree/master/datasets/AAPD
由于fastText包运行文本分类模型用不到验证集,所以我把训练集和验证集合并作为训练集。
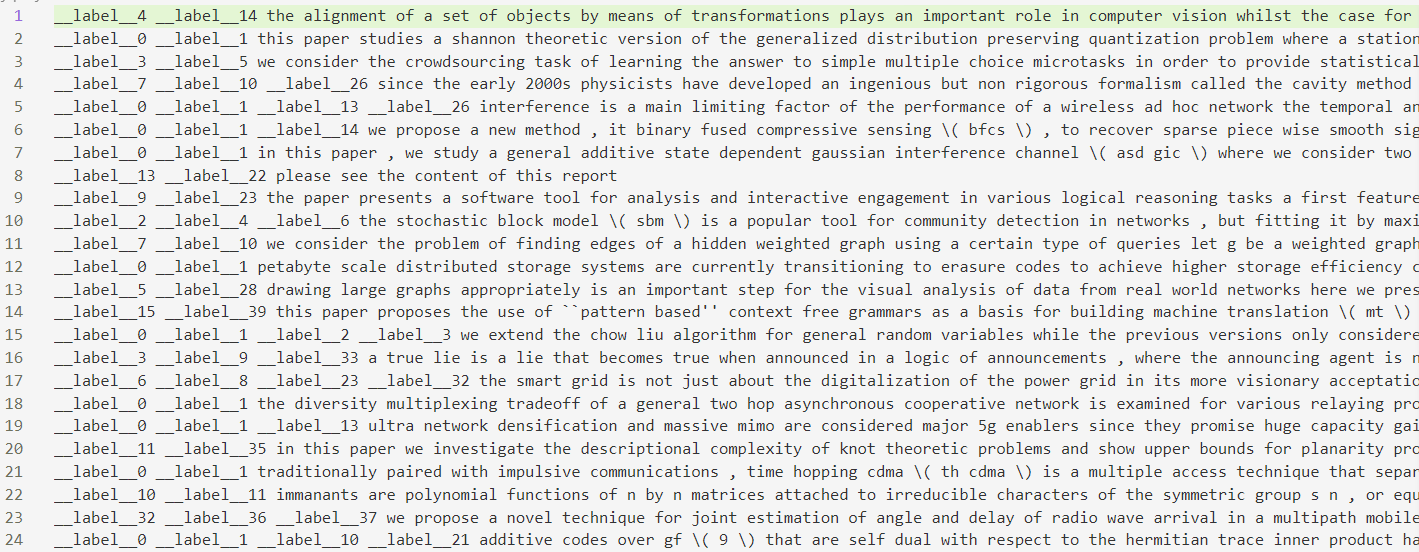
原始数据长这样:000000000000000000001000000000000000000000000010000000 the relation between pearson 's correlation coefficient and salton 's cosine measure is revealed based on the different possible values of the division of the l1 norm and the l2 norm of a vector these different values yield a sheaf of increasingly straight lines which form together a cloud of points , being the investigated relation the theoretical results are tested against the author co citation relations among 24 informetricians for whom two matrices can be constructed , based on co citations the asymmetric occurrence matrix and the symmetric co citation matrix both examples completely confirm the theoretical results the results enable us to specify an algorithm which provides a threshold value for the cosine above which none of the corresponding pearson correlations would be negative using this threshold value can be expected to optimize the visualization of the vector space
将原始数据处理为fastText适用的文件格式(理论上应该做的步骤:①使用NLTK进行分词,用法可参考我之前写的博文:NLTK使用教程(持续更新ing…)_诸神缄默不语的博客-CSDN博客 ②lowercase ③去除标点符号 ④更改格式 但是事实上我看了一下数据本身就已经做过了处理,所以直接更改格式了):
(注意在这里我把测试集也做了转换,但是这个格式的文件fastText仅支持直接使用test()得到测试指标,而不支持得到预测结果,因此后文我没有使用这个测试文件。如果必须要用的话可以用get_line()函数做转换,我觉得比直接用原始文件还麻烦)
import re

def convert2label(str_int:str):
    """将类似000000000000000000001000000000000000000000000010000000的值转换为label的格式"""
    iter1=re.finditer('1',str_int)
    s=''
    for obj in iter1:
        s+='__label__'+str(obj.start())+' '

    return s

folder_name=r'data/cls/AAPD'
name_map={'train':'train','dev':'train','test':'test'}
for k in name_map:
    original_file=open(folder_name+r'/'+k+'.tsv').readlines()
    destination_file=open(folder_name+r'/fasttext_'+name_map[k]+'.txt','a')
    data=[x.split('\t') for x in original_file]
    data=[convert2label(x[0])+x[1] for x in data]
    destination_file.writelines(data)
处理之后长这样:
用fastText运行文本分类模型,得到测试结果,并将预测结果与原始标签的独热编码格式都存储为json对象(存储为独热编码格式是因为这样更普适):
import fasttext,json
model=fasttext.train_supervised('data/cls/AAPD/fasttext_train.txt',loss='ova')
test_text_list=[x.split('\t') for x in open('data/cls/AAPD/test.tsv').readlines()]
length=len(test_text_list)
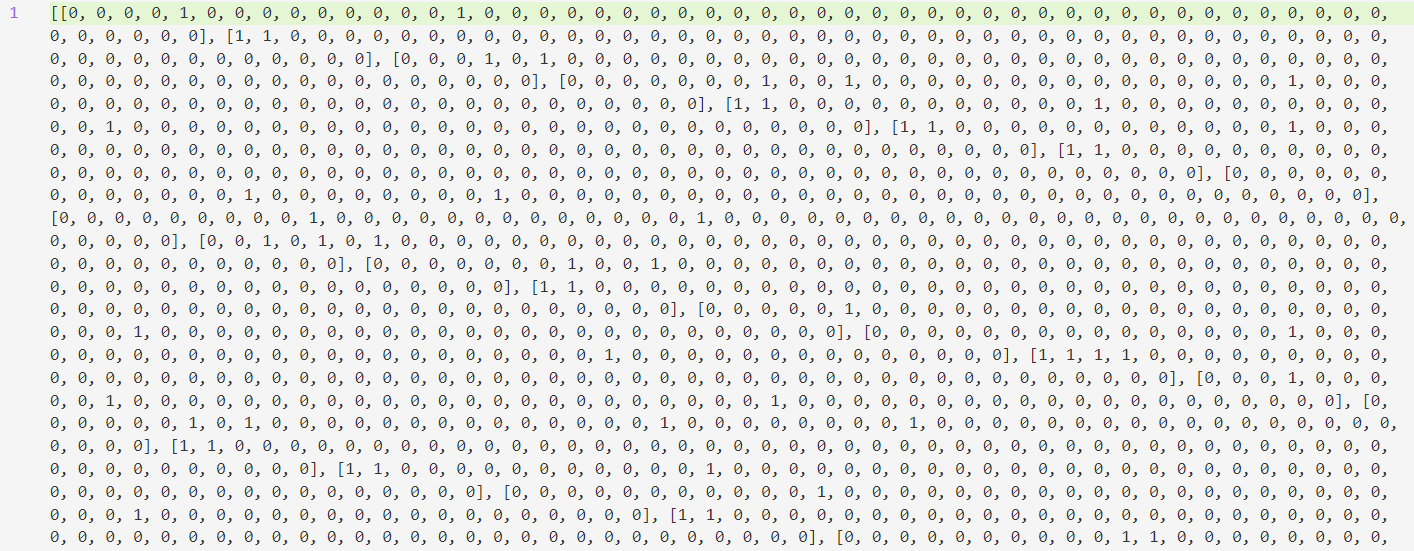
label_list=[[int(y) for y in list(x[0])] for x in test_text_list]
json.dump(label_list,open('data/cls/AAPD/label.json','w'))
test_text_list=[x[1].strip() for x in test_text_list]
predict_result=model.predict(test_text_list,k=-1,threshold=0.5)
#第一个元素是预测结果列表,第二个元素是概率列表。每个元素(列表)的每个元素是一个值
predict_result=predict_result[0] #每个元素是一个样本的预测结果,每个元素是__label__xx的格式
write_result=[[int(x[9:]) for x in y] for y in predict_result] #转换为int格式
predict_list=[[0 for _ in range(54)] for _ in range(1000)] #空列表
for sample_index in range(1000): #这个我实在是凑不出来了,直接遍历吧,反正也不多
sample=write_result[sample_index]
for factor in sample:
predict_list[sample_index][factor]=1
json.dump(predict_list,open('data/cls/AAPD/prediction.json','w'))
输出:
Read 9M words
Number of words:  69400
Number of labels: 54
Progress: 100.0% words/sec/thread:  423066 lr:  0.000000 avg.loss:  5.440953 ETA:   0h 0m 0s
存储结果:
2. 准确率accuracy
预测正确的样本(所有标签都预测正确)占所有样本的比例。
使用Python原生函数实现:
import json

label=json.load(open('data/cls/AAPD/label.json'))
prediction=json.load(open('data/cls/AAPD/prediction.json'))

accuracy=[label[x]==prediction[x] for x in range(len(label))].count(True)/len(label)
print(accuracy)
使用sklearn实现:
import json
from sklearn.metrics import accuracy_score

label=json.load(open('whj_project2/data/cls/AAPD/label.json'))
prediction=json.load(open('whj_project2/data/cls/AAPD/prediction.json'))

accuracy=accuracy_score(label,prediction)
print(accuracy)
(对应的函数文档:sklearn.metrics.accuracy_score — scikit-learn 1.1.1 documentation)
输出:0.276
3. Precision值
模型预测为正值的样本中,真实标签也是正值的样本所占的比例。
sklearn的函数文档:sklearn.metrics.precision_score — scikit-learn 1.1.1 documentation
3.1 Micro-P
计算所有预测结果中的正值中预测正确的比例。
使用Python的原生函数实现:
import json

label=json.load(open('data/cls/AAPD/label.json'))
prediction=json.load(open('data/cls/AAPD/prediction.json'))

pp_list=[x.count(1) for x in prediction]
pp=sum(pp_list)
tp_list=[[label[y][x]==1 and prediction[y][x]==1 for x in range(len(prediction[0]))].count(True) for y in range(len(prediction))]
tp=sum(tp_list)
print(tp/pp)
使用sklearn实现:
import json
from sklearn.metrics import precision_score

label=json.load(open('data/cls/AAPD/label.json'))
prediction=json.load(open('data/cls/AAPD/prediction.json'))

print(precision_score(np.array(label), np.array(prediction), average='micro'))
输出:0.8247272727272728
3.2 Macro-P
计算每一类标签对应的预测正值中预测正确的比例,然后将所有标签的P值求平均。
如果某一类标签没有预测正值,sklearn的默认处理方式是将P值置0并报警告信息,本文在原生函数实现中也采用了这一方法。
使用Python原生函数实现:
import json
from statistics import mean

label=json.load(open('data/cls/AAPD/label.json'))
prediction=json.load(open('data/cls/AAPD/prediction.json'))

p_list=[0 for _ in range(len(label[0]))]
for label_index in range(len(label[0])):
    l=[x[label_index] for x in label]
    p=[x[label_index] for x in prediction]
    if p.count(1)==0:
        print('索引为'+str(label_index)+'的标签无正预测值!')
    else:
        p_list[label_index]=[l[x]==1 and p[x]==1 for x in range(len(l))].count(1)/p.count(1)
print(mean(p_list))
输出:
索引为26的标签无正预测值!
索引为28的标签无正预测值!
索引为30的标签无正预测值!
索引为32的标签无正预测值!
索引为35的标签无正预测值!
索引为36的标签无正预测值!
索引为37的标签无正预测值!
索引为41的标签无正预测值!
索引为42的标签无正预测值!
索引为44的标签无正预测值!
索引为45的标签无正预测值!
索引为46的标签无正预测值!
索引为47的标签无正预测值!
索引为48的标签无正预测值!
索引为49的标签无正预测值!
索引为50的标签无正预测值!
索引为51的标签无正预测值!
索引为52的标签无正预测值!
索引为53的标签无正预测值!
0.4440190824913562
使用sklearn实现:
import json
from sklearn.metrics import precision_score

label=json.load(open('data/cls/AAPD/label.json'))
prediction=json.load(open('data/cls/AAPD/prediction.json'))

print(precision_score(label,prediction, average='macro'))
输出:
env_path/lib/python3.8/site-packages/sklearn/metrics/_classification.py:1327: UndefinedMetricWarning: Precision is ill-defined and being set to 0.0 in labels with no predicted samples. Use `zero_division` parameter to control this behavior.
  _warn_prf(average, modifier, msg_start, len(result))
0.4440190824913562
4. Recall值
真实标签为正值的被预测正确的概率。
sklearn的函数文档:sklearn.metrics.recall_score — scikit-learn 1.1.1 documentation
4.1 Micro-R
计算所有真实标签为正值的被预测正确的概率。
使用Python的原生函数实现:
import json

label=json.load(open('data/cls/AAPD/label.json'))
prediction=json.load(open('data/cls/AAPD/prediction.json'))

lp_list=[x.count(1) for x in label]
lp=sum(lp_list)
tp_list=[[label[y][x]==1 and prediction[y][x]==1 for x in range(len(prediction[0]))].count(True) for y in range(len(prediction))]
tp=sum(tp_list)
print(tp/lp)
使用sklearn实现:
import json
from sklearn.metrics import recall_score

label=json.load(open('data/cls/AAPD/label.json'))
prediction=json.load(open('data/cls/AAPD/prediction.json'))

print(recall_score(label,prediction, average='micro'))
输出:0.4684014869888476
4.2 Macro-R
计算每一类标签对应的真实正值中预测正确的比例,然后将所有标签的R值求平均。
如果某一类标签没有真实正值,sklearn的默认处理方式是将R值置0并报警告信息,本文在原生函数实现中也采用了这一方法。(这种情况有毛病,不应该出现这种情况的)
使用Python原生函数实现:
import json
from statistics import mean

label=json.load(open('data/cls/AAPD/label.json'))
prediction=json.load(open('data/cls/AAPD/prediction.json'))

p_list=[0 for _ in range(len(label[0]))]
for label_index in range(len(label[0])):
    l=[x[label_index] for x in label]
    p=[x[label_index] for x in prediction]
    if l.count(1)==0:
        print('索引为'+str(label_index)+'的标签无真实正值!')
    else:
        p_list[label_index]=[l[x]==1 and p[x]==1 for x in range(len(l))].count(1)/l.count(1)
print(mean(p_list))
输出:
0.21012970014737198
使用sklearn实现:
import json
from sklearn.metrics import recall_score

label=json.load(open('data/cls/AAPD/label.json'))
prediction=json.load(open('data/cls/AAPD/prediction.json'))

print(recall_score(label,prediction, average='macro'))
输出:
0.210129700147372
这个差异明显地是由于精度问题。
5. F1得分
F 1 = 2 ∗ ( p r e c i s i o n ∗ r e c a l l ) / ( p r e c i s i o n + r e c a l l ) F1 = 2 * (precision * recall) / (precision + recall) F1=2∗(precision∗recall)/(precision+recall)
sklearn的函数文档:sklearn.metrics.f1_score — scikit-learn 1.1.1 documentation
5.1 Micro-F1
micro F1的得分分别就是算micro的P和R,用原生Python直接把对应的结果算出来再计算F1值即可。以下仅介绍使用sklearn的实现方式。
import json
from sklearn.metrics import f1_score

label=json.load(open('data/cls/AAPD/label.json'))
prediction=json.load(open('data/cls/AAPD/prediction.json'))

print(f1_score(label,prediction, average='micro'))
输出:0.5974710221285564
2*(0.8247272727272728*0.4684014869888476)/(0.8247272727272728+0.4684014869888476)
5.2 Macro-F1
macro-F1是计算每一类的F1值,然后求平均。
sklearn对除以0的默认处理方式是将结果置0并报警告信息,本文在原生函数实现中也采用了这一方法。
使用Python原生函数实现:
import json
from statistics import mean

label=json.load(open('data/cls/AAPD/label.json'))
prediction=json.load(open('data/cls/AAPD/prediction.json'))

p_list=[0 for _ in range(len(label[0]))]
r_list=[0 for _ in range(len(label[0]))]
for label_index in range(len(label[0])):
    l=[x[label_index] for x in label]
    p=[x[label_index] for x in prediction]
    if p.count(1)==0:
        print('索引为'+str(label_index)+'的标签无正预测值!')
    else:
        p_list[label_index]=[l[x]==1 and p[x]==1 for x in range(len(l))].count(1)/p.count(1)

    if l.count(1)==0:
        print('索引为'+str(label_index)+'的标签无真实正值!')
    else:
        r_list[label_index]=[l[x]==1 and p[x]==1 for x in range(len(l))].count(1)/l.count(1)

f_list=[(0 if p_list[x]+r_list[x]==0 else 2*p_list[x]*r_list[x]/(p_list[x]+r_list[x])) for x in range(len(label[0]))]
print(mean(f_list))
输出:
索引为26的标签无正预测值!
索引为28的标签无正预测值!
索引为30的标签无正预测值!
索引为32的标签无正预测值!
索引为35的标签无正预测值!
索引为36的标签无正预测值!
索引为37的标签无正预测值!
索引为41的标签无正预测值!
索引为42的标签无正预测值!
索引为44的标签无正预测值!
索引为45的标签无正预测值!
索引为46的标签无正预测值!
索引为47的标签无正预测值!
索引为48的标签无正预测值!
索引为49的标签无正预测值!
索引为50的标签无正预测值!
索引为51的标签无正预测值!
索引为52的标签无正预测值!
索引为53的标签无正预测值!
0.26380909234445127
使用sklearn的实现方式:
import json
from sklearn.metrics import f1_score

label=json.load(open('data/cls/AAPD/label.json'))
prediction=json.load(open('data/cls/AAPD/prediction.json'))

print(f1_score(label,prediction, average='macro'))
输出:0.26380909234445127
6. 其他
- 本文使用的示例是multi-class multi-label任务,如果是multi-class one-label任务的话,还会出现另一种特性,就是accuracy==micro F1。可以参考这两个网站:accuracy f1 为什么多分类 等于micro - CSDN 和 machine learning - Is F1 micro the same as Accuracy? - Stack Overflow


 1万+
1万+


 被折叠的 条评论
为什么被折叠?
被折叠的 条评论
为什么被折叠?
 到【灌水乐园】发言


