


采取方式
Elastic Agent :更完善的功能
Metricbeat:轻量级指标收集(采用)
传统收集方法:使用内部导出器收集指标,已不建议
安装 metricbeat
Download Metricbeat • Ship Metrics to Elasticsearch | Elastic
解压
tar xzvf metricbeat-8.7.0-linux-x86_64.tar.gz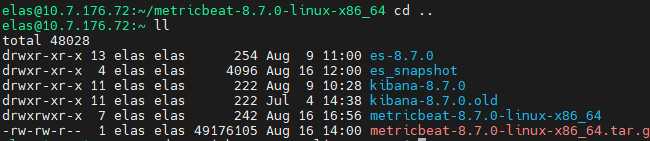
监控es
详细步骤
启动 elasticsearch-xpack
cd metricbeat-8.7.0-linux-x86_64/
./metricbeat modules enable elasticsearch-xpack
配置 elasticsearch-xpack
cd modules.d
vim elasticsearch-xpack.yml
改为如下内容:
module: elasticsearch
  xpack.enabled: true
  period: 10s
  hosts: ["http://10.7.176.72:9200","http://10.7.176.73:9200","http://10.7.176.74:9200"]
  username: "elastic"
  password: "Mvwm@n12nal"
配置 metricbeat.yml (重点)
cd ..
vim metricbeat.yml
output.elasticsearch:
hosts: ["http://10.7.176.72:9200","http://10.7.176.73:9200","http://10.7.176.74:9200"]
username: "elastic"
password: "Mvwm@n12nal"
启动 metricbeat
# 前台启动
./metricbeat -e
# 后台启动
nohup ./metricbeat -e -c metricbeat.yml -d "publish" & > nohup.out
关闭跨集群监控(重要)
# 关闭跨集群监控,否则堆栈监控页面打不开(因为角色中不包含某个跨集群的角色,可能需要自己新建)
monitoring.ui.ccs.enabled: false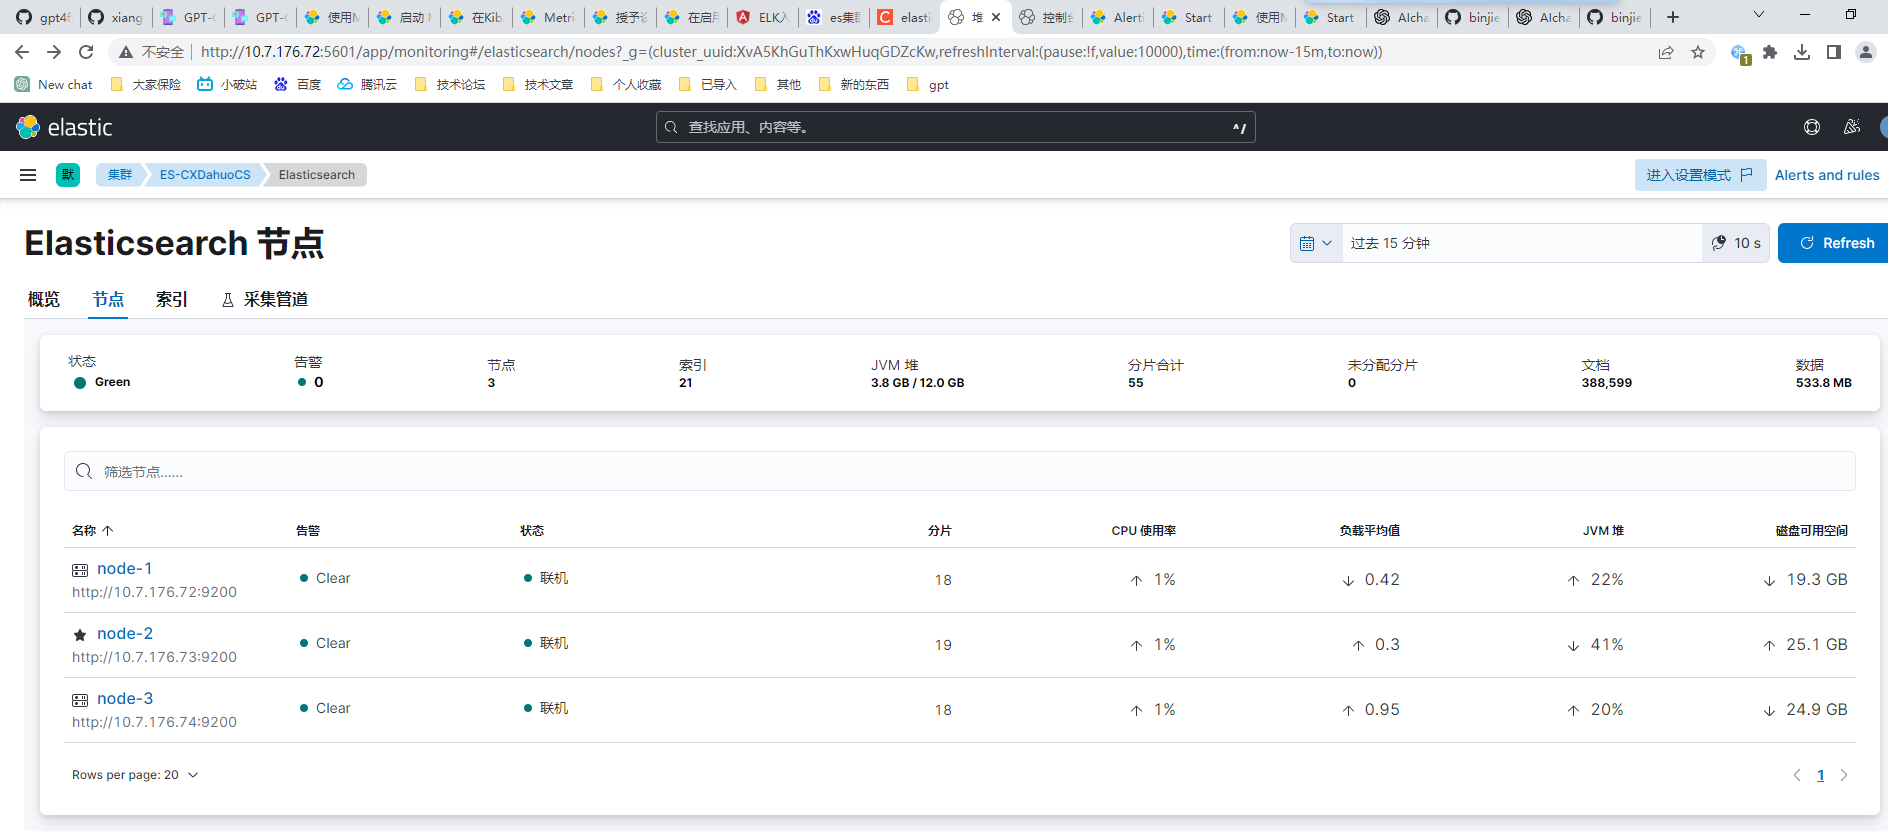
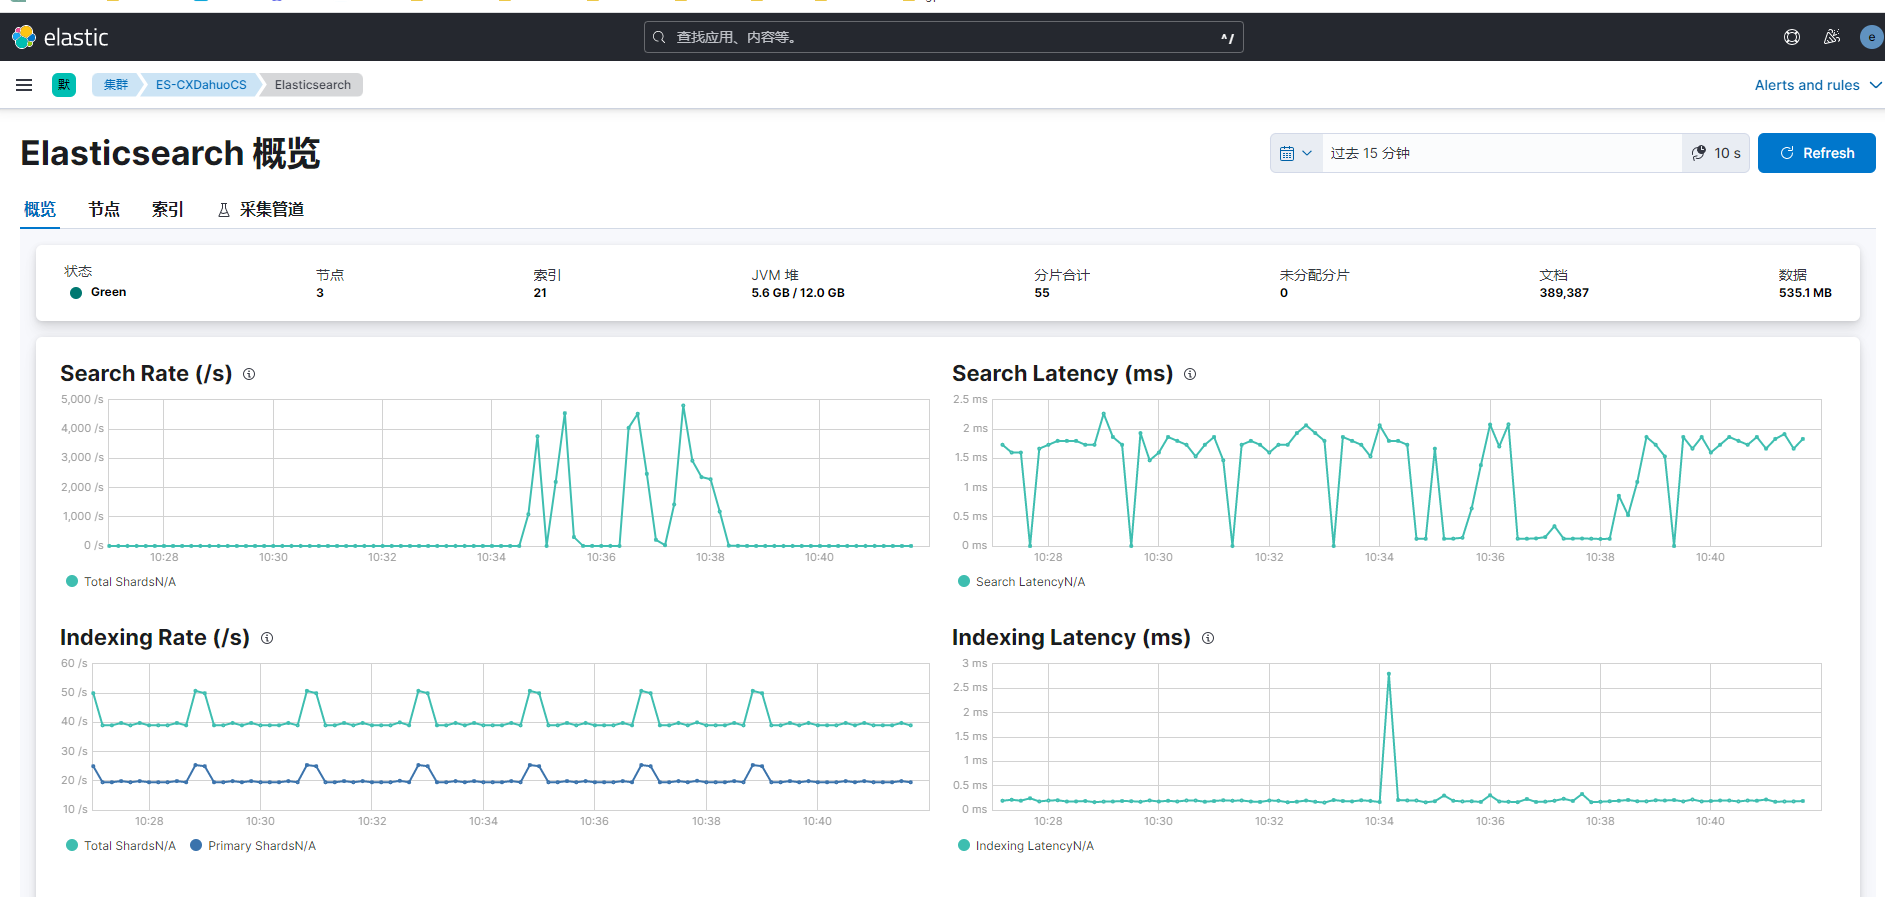
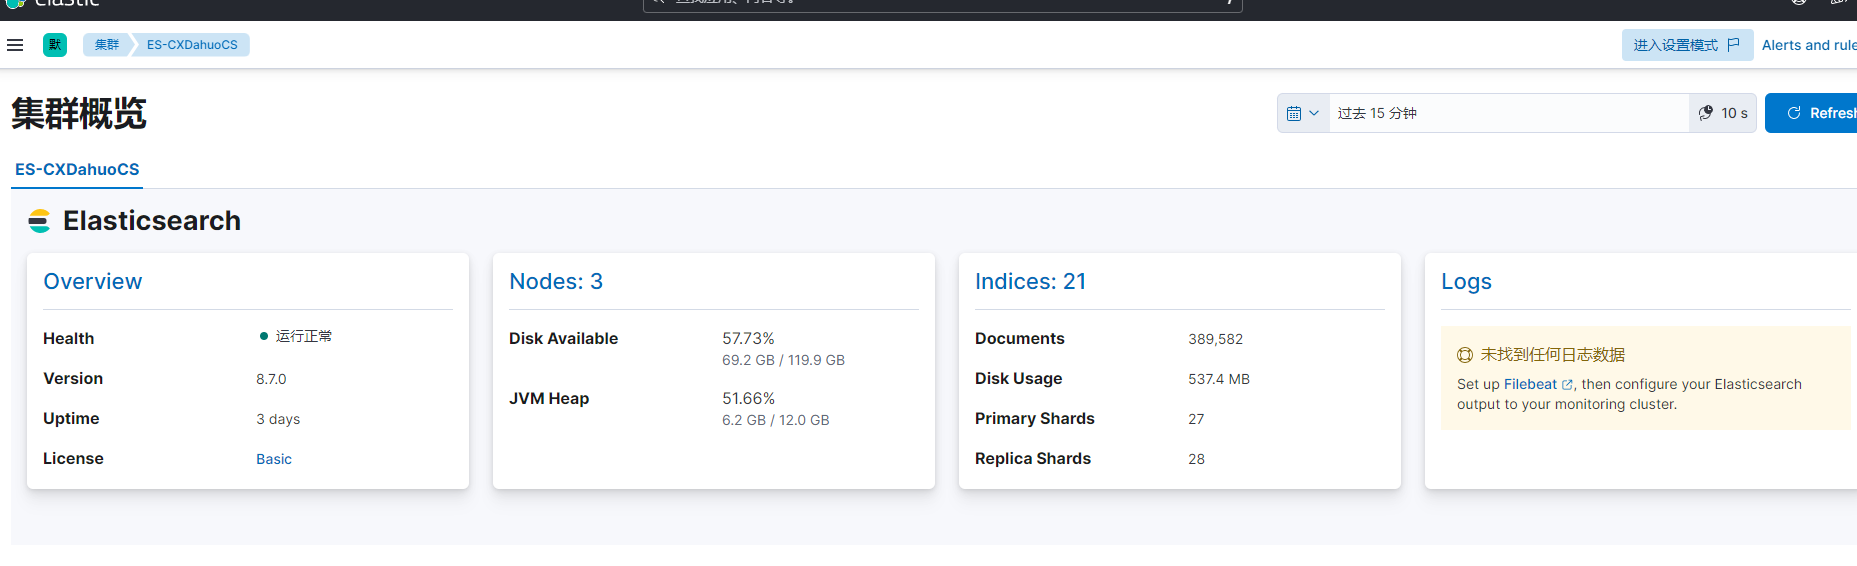
大功告成!!撒花
遇到的坑
如果部署的是集群,但是只在主节点部署 Metricbeat 测试,必须要在es的host那里写入所有节点,写单节点就怎么也打不开
参考文档
使用Elasticsearch + Kibana快速搭建监控看板
监控 logstash
详细步骤
启动 Logstash
创建 Created Logstash keystore
cd ~/logstash-8.7.0
./bin/logstash-keystore create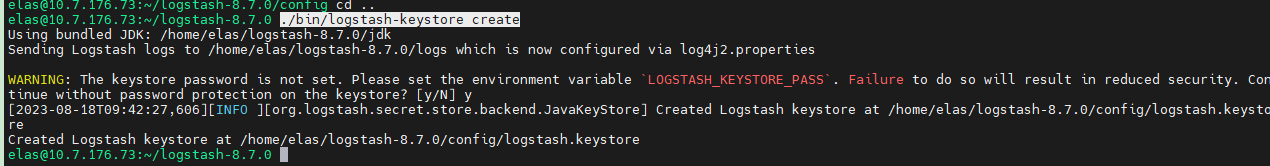
创建一些 key: ES_HOST 及 ES_PWD
./bin/logstash-keystore add ES_HOST
输入:"http://10.7.176.72:9200","http://10.7.176.73:9200","http://10.7.176.74:9200"
./bin/logstash-keystore add ES_PWD
输入:Mvwm@n12nal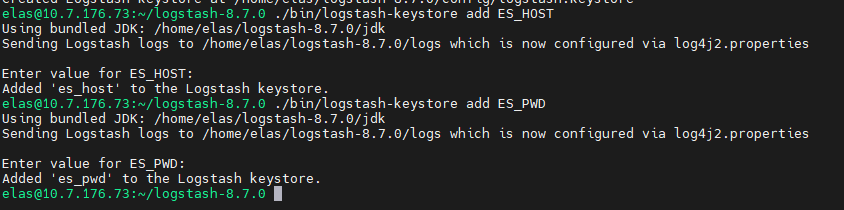
设置 logstash.yml
cd ~/logstash-8.7.0/config/
vim logstash.yml
xpack.monitoring.enabled: true
xpack.monitoring.elasticsearch.username: logstash_system
xpack.monitoring.elasticsearch.password: "${ES_PWD}"
xpack.monitoring.elasticsearch.hosts: ["${ES_HOST}"]修改 logstash_system 的密码 为 Mvwm@n12nal

启动 logstash-xpack 模块
 cd ~/metricbeat-8.7.0-linux-x86_64/
./metricbeat modules enable logstash-xpack
./metricbeat modules list
# 关闭不要的模块
# ./metricbeat modules disable system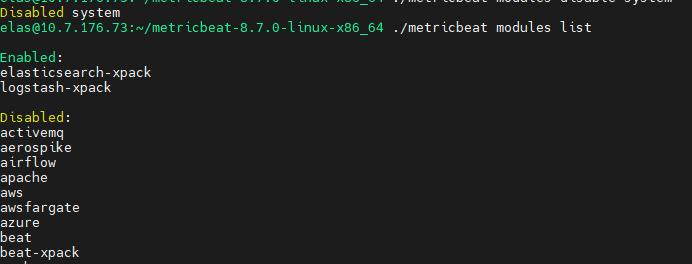
配置 modules.d/logstash.yml 文件(略)
cd modules.d/
重启 metricbeat (logstash的那台机器)
ps -ef | grep metricbeat
kill 13874
回到bin目录
cd ~/es-8.7.0/bin/
nohup ./elasticsearch &
tail -f nohup.out
# 前台启动
./metricbeat -e
# 后台启动
nohup ./metricbeat -e -c metricbeat.yml -d "publish" & > nohup.out
待定:启动失败,推测logstash没启动


 1033
1033


 被折叠的 条评论
为什么被折叠?
被折叠的 条评论
为什么被折叠?
 到【灌水乐园】发言


