


一、概述
Prometheus产品简介
Prometheus是一个最初在SoundCloud上构建的开源系统监视和警报工具包。自2012年成立以来,很多公司和组织都采用了Prometheus,该项目拥有非常活跃的开发者和用户社区。 它现在是一个独立的开源项目,可以独立于任何公司进行维护。 为了强调这一点,并阐明项目的治理结构,Prometheus于2016年加入Cloud Native Computing Foundation(云原生基金会),作为继Kubernetes之后的第二个托管项目。
Prometheus的主要特征有:
-
多维度数据模型-由指标键值对标识的时间序列数据组成
-
PromQL,一种灵活的查询语言
-
不依赖分布式存储; 单个服务器节点是自治的
-
以HTTP方式,通过pull模型拉取时间序列数据
-
支持通过中间网关推送时间序列数据
-
通过服务发现或者静态配置,来发现目标服务对象
-
支持多种多样的图表和界面展示
二、安装部署
1、安装cadvisor
docker pull google/cadvisor
docker pull grafana/grafana
docker pull prom/prometheus
docker run -d \
--volume=/:/rootfs:ro \
--volume=/var/run:/var/run:ro \
--volume=/sys:/sys:ro \
--volume=/var/lib/docker/:/var/lib/docker:ro \
--volume=/dev/disk/:/dev/disk:ro \
--publish=8080:8080 \
--detach=true \
--name=cadvisor \
google/cadvisor:latest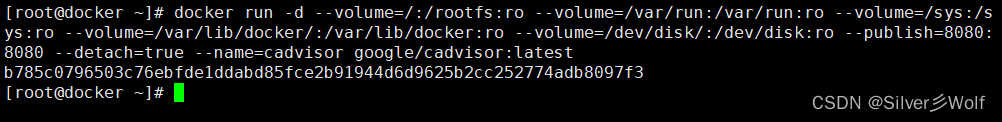
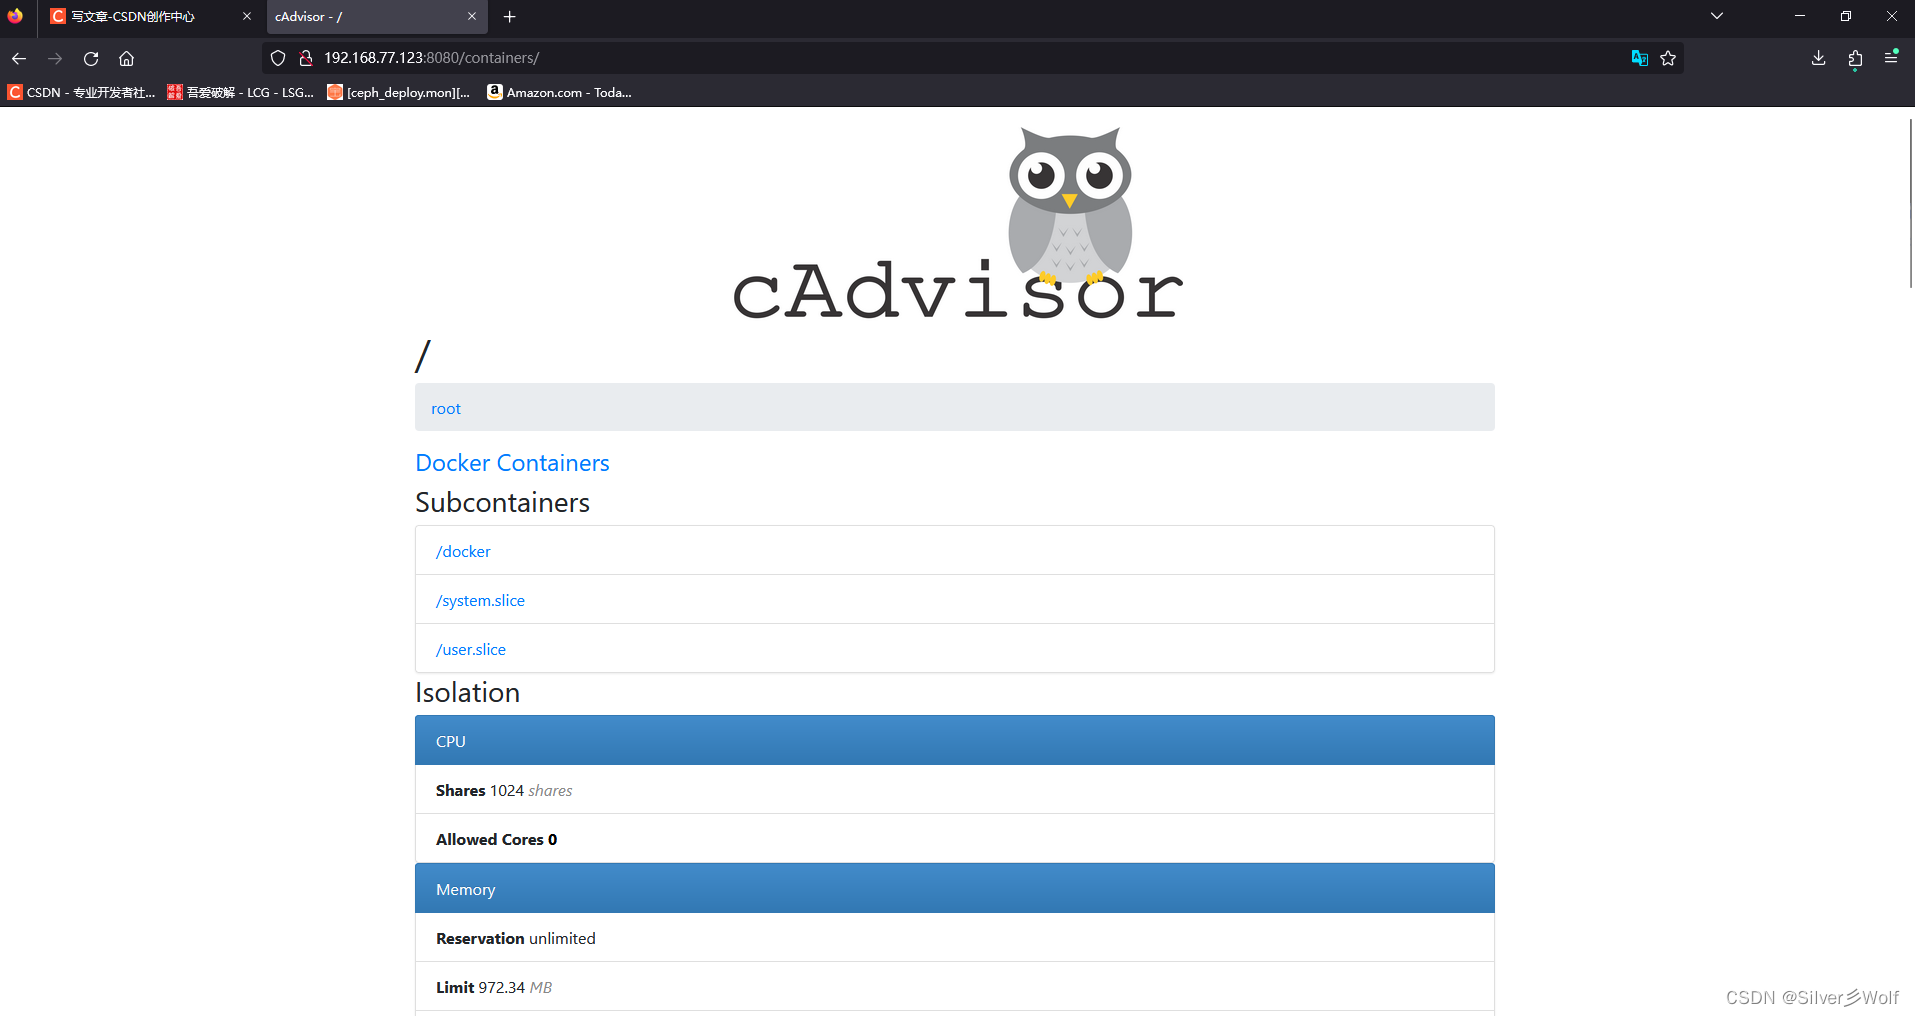
访问cadvisor页面
2、安装prometheus
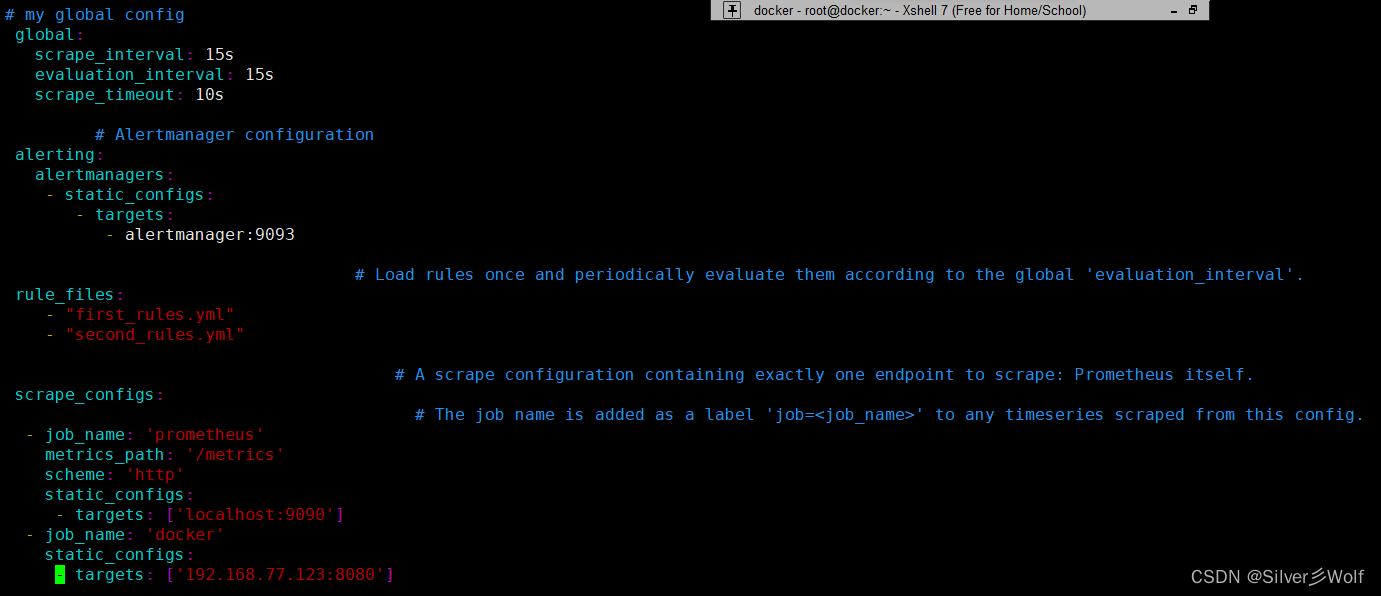
准备配置
vim /tmp/prometheus.yml
# my global config
 global:
   scrape_interval: 15s
   evaluation_interval: 15s
   scrape_timeout: 10s

         # Alertmanager configuration
 alerting:
   alertmanagers:
    - static_configs:
       - targets:
          - alertmanager:9093

                                   # Load rules once and periodically evaluate them according to the global 'evaluation_interval'.
 rule_files:
    - "first_rules.yml"
    - "second_rules.yml"

                                       # A scrape configuration containing exactly one endpoint to scrape: Prometheus itself.
 scrape_configs:
                                         # The job name is added as a label 'job=<job_name>' to any timeseries scraped from this config.
  - job_name: 'prometheus'
    metrics_path: '/metrics'
    scheme: 'http'
    static_configs:
     - targets: ['localhost:9090']
  - job_name: 'docker'
    static_configs:
     - targets: ['192.168.77.123:8080']
启动容器
docker run -d \
--name=prometheus  -p 9090:9090  \
-v /tmp/prometheus.yml:/etc/prometheus/prometheus.yml \
 -v /etc/localtime:/etc/localtime \
prom/prometheus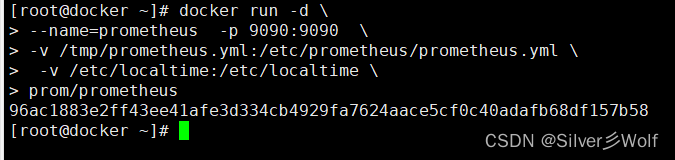
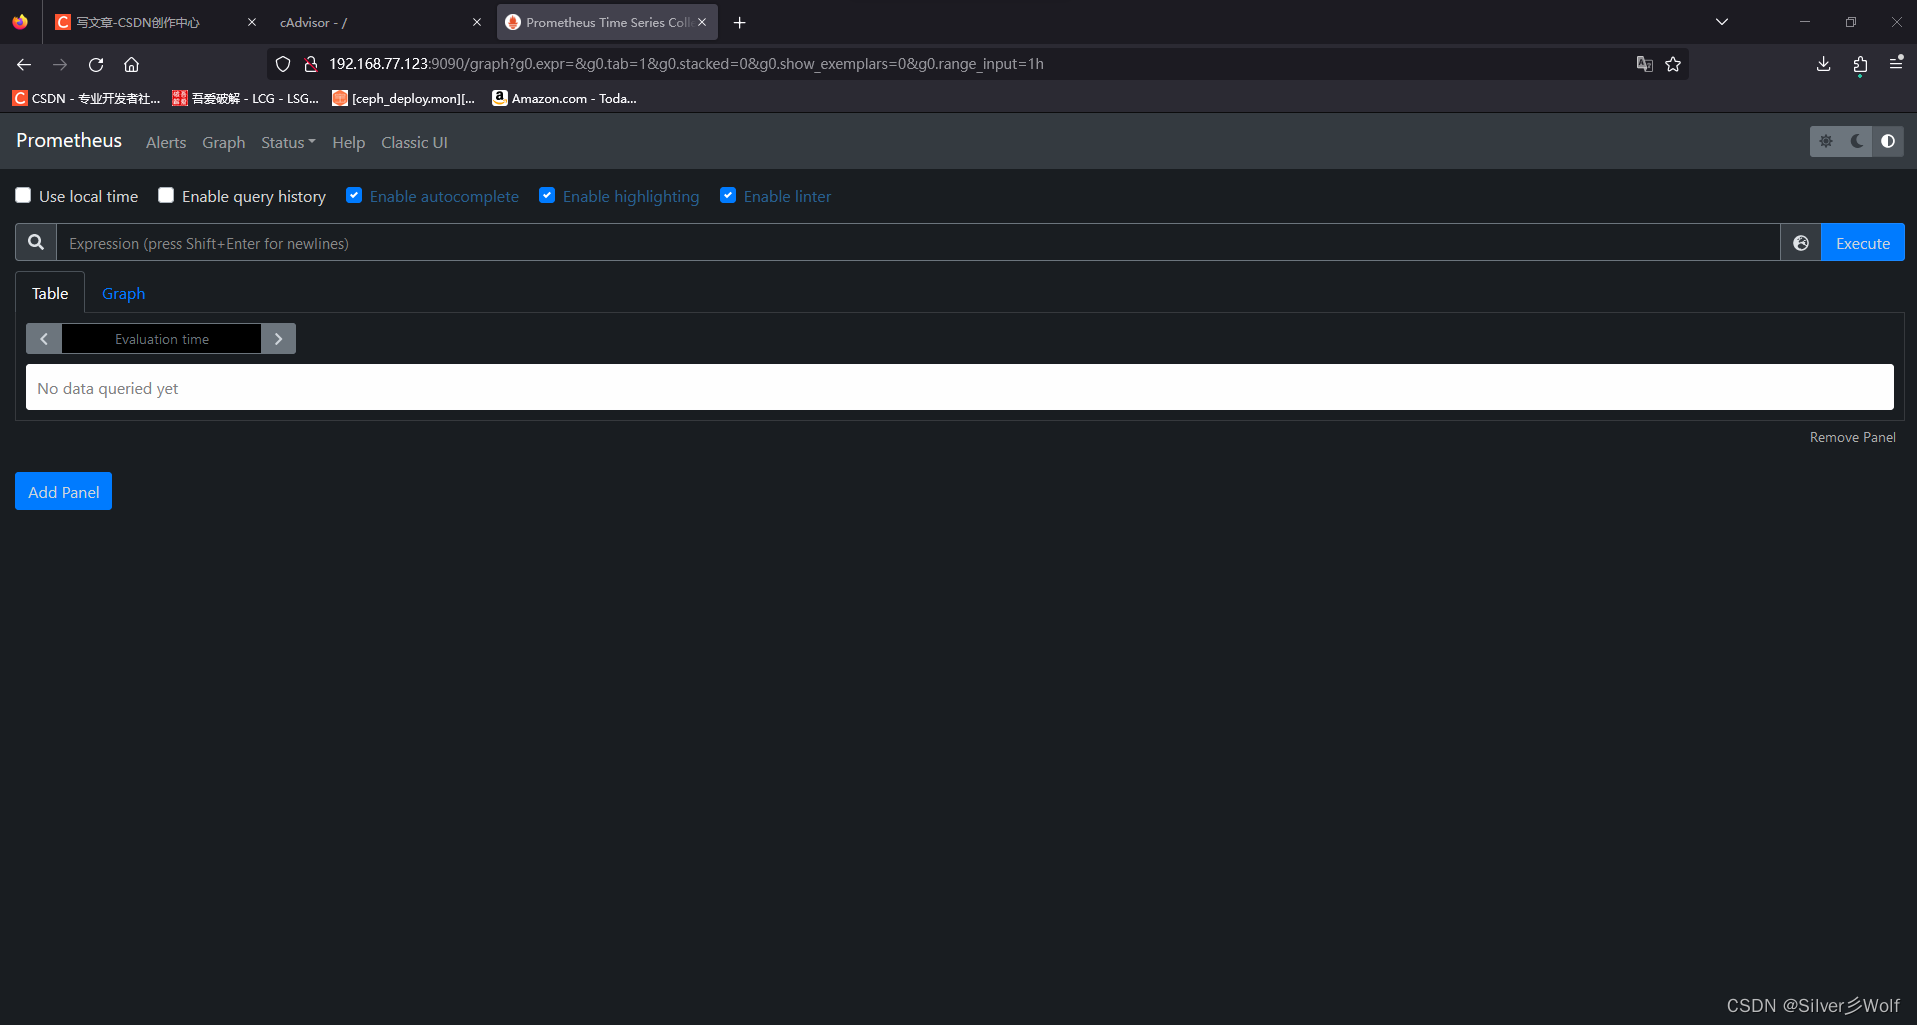
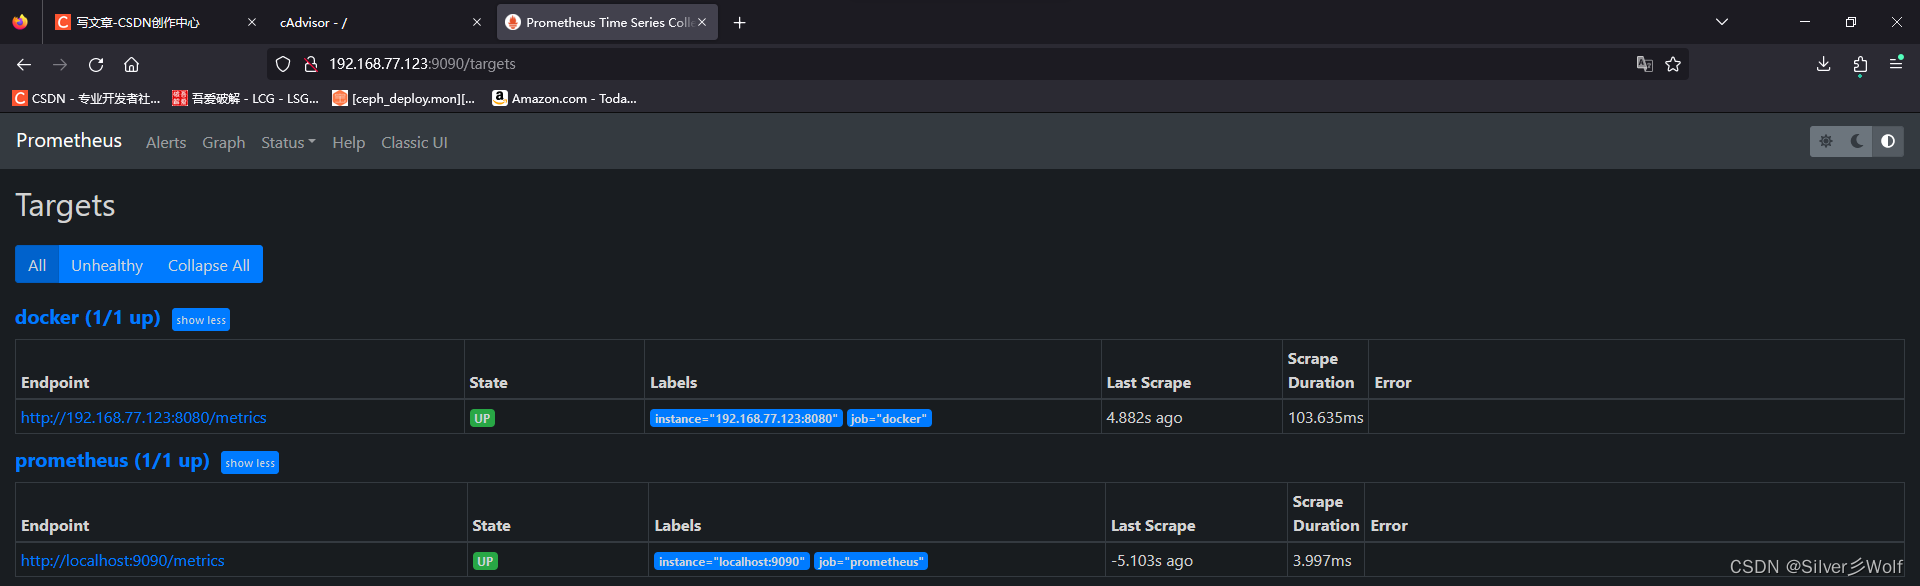
访问页面

在这里可以看到docker和prometheus的状态为UP
3、部署Granfana
docker run -d \
--name=grafana \
 -p 3000:3000 \
grafana/grafana
配置granfana
访问IP:3000
默认用户是admin密码是admin
登录后会让用户重新设置密码

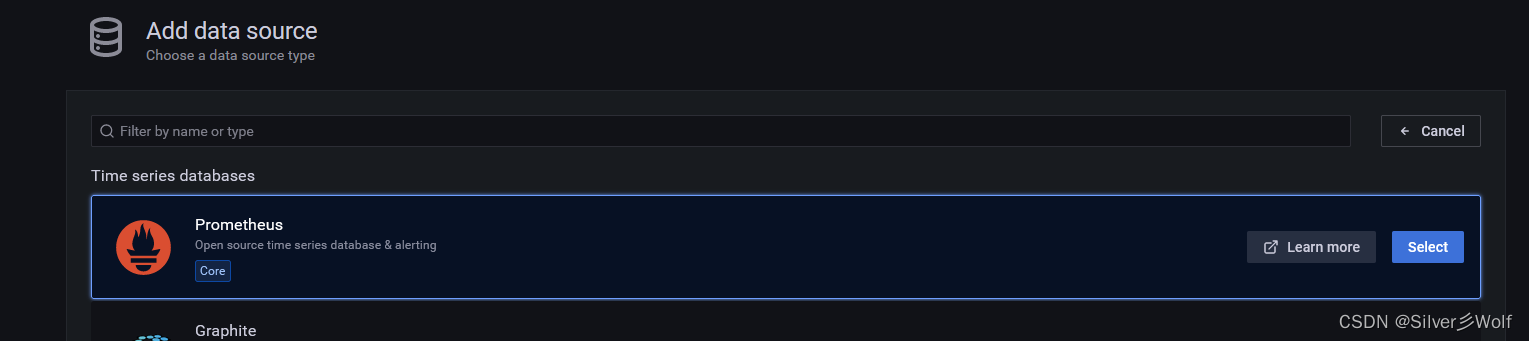
配置数据源

选择 Prometheus
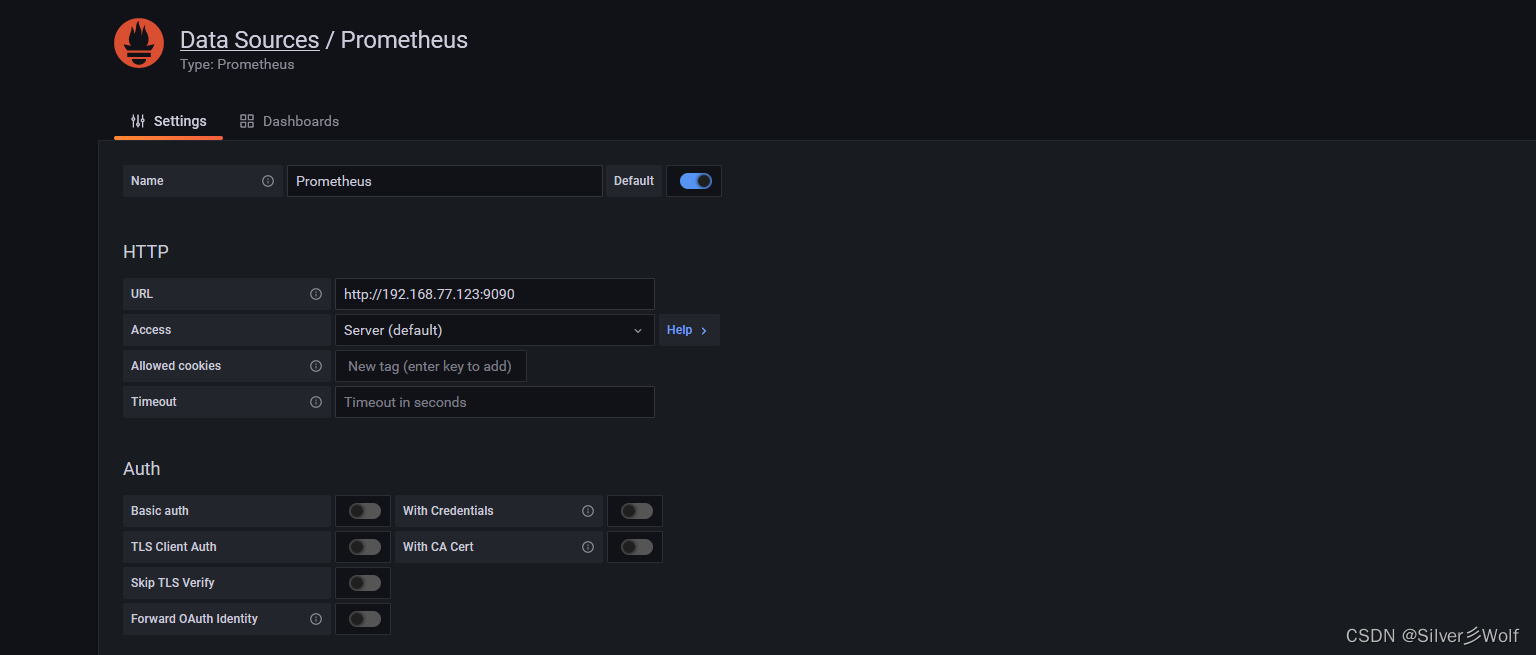


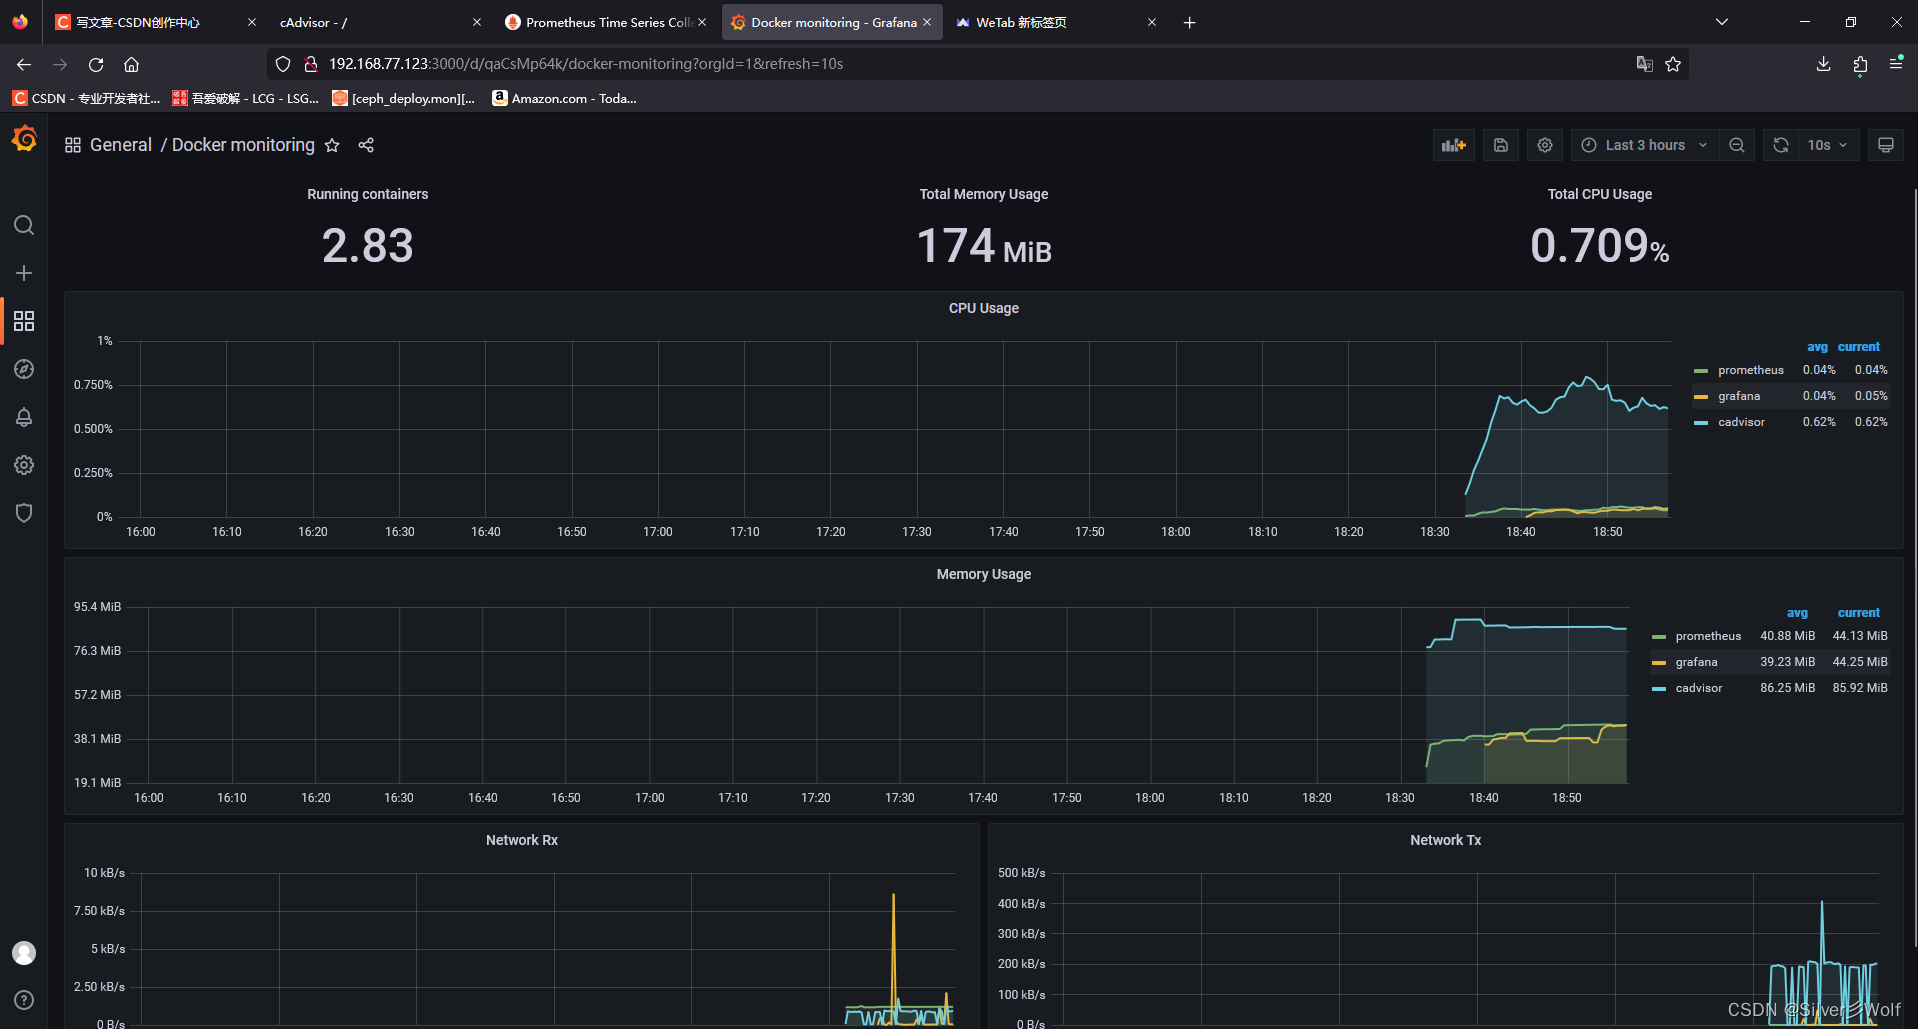
已经可以看到监控项了


 1204
1204


 被折叠的 条评论
为什么被折叠?
被折叠的 条评论
为什么被折叠?
 到【灌水乐园】发言


