


废话不多说,直接上代码。
要求:正确安装了matplotlib库
import matplotlib.pyplot as plt
import numpy as np
def demo_test():
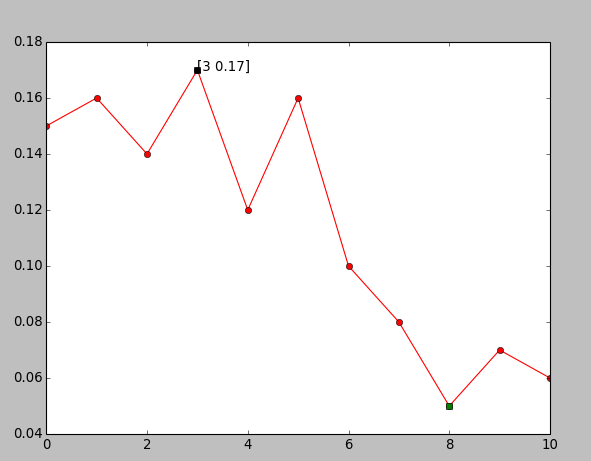
a=np.array([0.15,0.16,0.14,0.17,0.12,0.16,0.1,0.08,0.05,0.07,0.06]);
max_indx=np.argmax(a)#max value index
min_indx=np.argmin(a)#min value index
plt.plot(a,'r-o')
plt.plot(max_indx,a[max_indx],'ks')
show_max='['+str(max_indx)+' '+str(a[max_indx])+']'
plt.annotate(show_max,xytext=(max_indx,a[max_indx]),xy=(max_indx,a[max_indx]))
plt.plot(min_indx,a[min_indx],'gs')
plt.show()
if __name__=="__main__":
demo_test();
效果图如下:


 821
821

 被折叠的 条评论
为什么被折叠?
被折叠的 条评论
为什么被折叠?
 到【灌水乐园】发言


