贴个群号
WebGIS学习交流群461555818,欢迎大家。
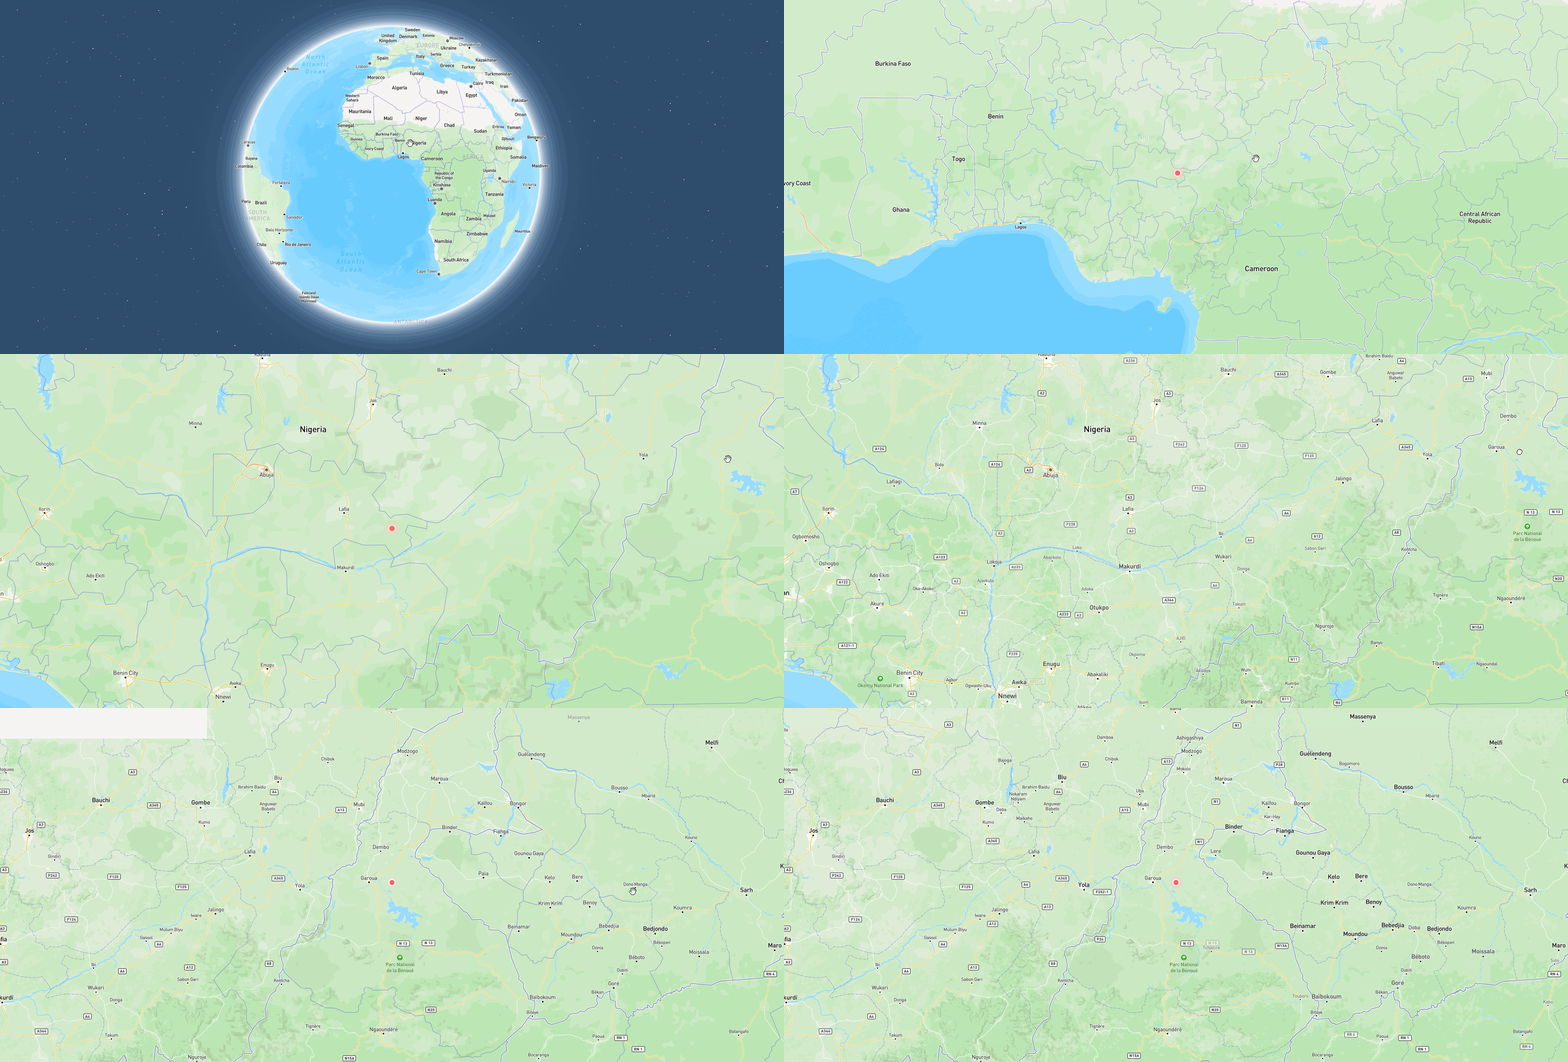
成果图

正常线的定位,就是高亮,然后缩放过去就可以了,但是点的定位,最好是做一个这样的效果,覆盖在点图标之上,效果就很好了。
操作
https://docs.mapbox.com/mapbox-gl-js/example/add-image-animated/
借鉴的mapbox的这个例子,核心原理就是我们只需要把这个点图层开始改为空的,等我们要定位的时候,再传入坐标给它添加数据,然后三秒之后,再把图层的source数据设置为空,代码很简单,主要是思路,具体代码如下:
<!DOCTYPE html>
<html>
<head>
<meta charset="utf-8">
<title>Add an animated icon to the map</title>
<meta name="viewport" content="initial-scale=1,maximum-scale=1,user-scalable=no">
<link href="https://api.mapbox.com/mapbox-gl-js/v2.15.0/mapbox-gl.css" rel="stylesheet">
<script src="https://api.mapbox.com/mapbox-gl-js/v2.15.0/mapbox-gl.js"></script>
<style>
body { margin: 0; padding: 0; }
#map { position: absolute; top: 0; bottom: 0; width: 100%; }
</style>
</head>
<body>
<div id="map"></div>

<script>
	mapboxgl.accessToken = 'pk.eyJ1Ijoic2FrdXJhc2p5IiwiYSI6ImNsOThtZnd2bDBya2Qzd212aXdzcTJyNjcifQ.CFg6DX03N25sPliiIyjnmQ';
    const map = new mapboxgl.Map({
        container: 'map',
        center: [0, 0],
        zoom: 2,
        // Choose from Mapbox's core styles, or make your own style with Mapbox Studio
        style: 'mapbox://styles/mapbox/streets-v12'
    });

    const size = 100;

    // This implements `StyleImageInterface`
    // to draw a pulsing dot icon on the map.
    const pulsingDot = {
        width: size,
        height: size,
        data: new Uint8Array(size * size * 4),

        // When the layer is added to the map,
        // get the rendering context for the map canvas.
        onAdd: function () {
            const canvas = document.createElement('canvas');
            canvas.width = this.width;
            canvas.height = this.height;
            this.context = canvas.getContext('2d');
        },

        // Call once before every frame where the icon will be used.
        render: function () {
            const duration = 1000;
            const t = (performance.now() % duration) / duration;

            const radius = (size / 2) * 0.3;
            const outerRadius = (size / 2) * 0.7 * t + radius;
            const context = this.context;

            // Draw the outer circle.
            context.clearRect(0, 0, this.width, this.height);
            context.beginPath();
            context.arc(
                this.width / 2,
                this.height / 2,
                outerRadius,
                0,
                Math.PI * 2
            );
            context.fillStyle = `rgba(255, 200, 200, ${1 - t})`;
            context.fill();

            // Draw the inner circle.
            context.beginPath();
            context.arc(
                this.width / 2,
                this.height / 2,
                radius,
                0,
                Math.PI * 2
            );
            context.fillStyle = 'rgba(255, 100, 100, 1)';
            context.strokeStyle = 'white';
            context.lineWidth = 2 + 4 * (1 - t);
            context.fill();
            context.stroke();

            // Update this image's data with data from the canvas.
            this.data = context.getImageData(
                0,
                0,
                this.width,
                this.height
            ).data;

            // Continuously repaint the map, resulting
            // in the smooth animation of the dot.
            map.triggerRepaint();

            // Return `true` to let the map know that the image was updated.
            return true;
        }
    };

    map.on('load', () => {

        map.addImage('pulsing-dot', pulsingDot, { pixelRatio: 2 });

        map.addSource('dot-point', {
            'type': 'geojson',
            'data': {
                'type': 'FeatureCollection',
                'features': []
            }
        });
        map.addLayer({
            'id': 'layer-with-pulsing-dot',
            'type': 'symbol',
            'source': 'dot-point',
            'layout': {
                'icon-image': 'pulsing-dot'
            }
        });
    });
    map.on('click',e=>{
        map.getSource('dot-point').setData({
            "type": "FeatureCollection",
            "features": [
                {
                    'type': 'Feature',
                    'geometry': {
                        'type': 'Point',
                        'coordinates':[e.lngLat.lng,e.lngLat.lat] // icon position [lng, lat]
                    }
                }
            ]
        })
        map.flyTo({
            center:[e.lngLat.lng,e.lngLat.lat],
            zoom:7
        })
        setTimeout(()=>{
            map.getSource('dot-point').setData({
                "type": "FeatureCollection",
                "features": [
                ]
            })

        },3000)
    })
</script>

</body>
</html>


 2514
2514


 被折叠的 条评论
为什么被折叠?


