


新建一个简单实例
1、使用命令行在项目目录下执行以下命令
cnpm install --save @antv/g62、创建容器
<div id="mountNode"></div>3、在需要用的 G6 的 JS 文件中导入
import G6 from '@antv/g6';4、 数据准备
引入 G6 的数据源为 JSON 格式的对象。该对象中需要有节点(nodes)和边(edges)字段,分别用数组表示:
const data = {
  // 点集
  nodes: [
    {
      id: 'node1', // String,该节点存在则必须,节点的唯一标识
      x: 100, // Number,可选,节点位置的 x 值
      y: 200, // Number,可选,节点位置的 y 值
    },
    {
      id: 'node2', // String,该节点存在则必须,节点的唯一标识
      x: 300, // Number,可选,节点位置的 x 值
      y: 200, // Number,可选,节点位置的 y 值
    },
  ],
  // 边集
  edges: [
    {
      source: 'node1', // String,必须,起始点 id
      target: 'node2', // String,必须,目标点 id
    },
  ],
};
注意
nodes数组中包含节点对象。每个节点对象中唯一的、必要的id以标识不同的节点,x、y指定该节点的位置;edges数组中包含边对象。source和target是每条边的必要属性,分别代表了该边的起始点id与 目标点id。- 点和边的其他属性参见链接:内置节点 和 内置边。
5、创建关系图
创建关系图(实例化)时,至少需要为图设置容器、宽和高。
const graph = new G6.Graph({
  container: 'mountNode', // String | HTMLElement,必须,在 Step 1 中创建的容器 id 或容器本身
  width: 800, // Number,必须,图的宽度
  height: 500, // Number,必须,图的高度
});
6、配置数据源,渲染
graph.data(data); // 读取 Step 2 中的数据源到图上
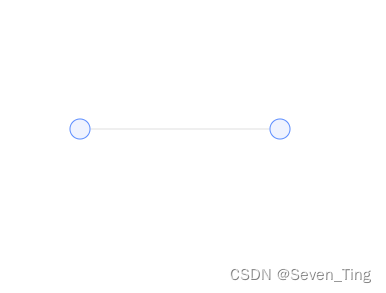
graph.render(); // 渲染图7、最终的结果
8、整体vue页面代码
<template>
  <div id="mountNode"></div>
</template>
<script>
import G6 from "@antv/g6";
export default {
  data() {
    return {
      name: "",
    };
  },
  mounted() {
    const data = {
      // 点集
      nodes: [
        {
          id: "node1", // String,该节点存在则必须,节点的唯一标识
          x: 100, // Number,可选,节点位置的 x 值
          y: 200, // Number,可选,节点位置的 y 值
        },
        {
          id: "node2", // String,该节点存在则必须,节点的唯一标识
          x: 300, // Number,可选,节点位置的 x 值
          y: 200, // Number,可选,节点位置的 y 值
        },
      ],
      // 边集
      edges: [
        {
          source: "node1", // String,必须,起始点 id
          target: "node2", // String,必须,目标点 id
        },
      ],
    };

    const graph = new G6.Graph({
      container: "mountNode", // String | HTMLElement,必须,在 Step 1 中创建的容器 id 或容器本身
      width: 800, // Number,必须,图的宽度
      height: 500, // Number,必须,图的高度
    });

    graph.data(data); // 读取 Step 2 中的数据源到图上
    graph.render(); // 渲染图
  },
};
</script>

<style scoped></style>


 1331
1331


 被折叠的 条评论
为什么被折叠?
被折叠的 条评论
为什么被折叠?
 到【灌水乐园】发言


