


英文是纯手打的!论文原文的summarizing and paraphrasing。可能会出现难以避免的拼写错误和语法错误,若有发现欢迎评论指正!文章偏向于笔记,谨慎食用!
目录
2.5. Materials and Classification Evaluation
2.6.1. Classification Results on Different Datasets
1. 省流版
1.1. 心得
(1)他消融实验居然替换别的模块消,好勇啊...不过这样感觉确实能说明它们模型挺牛掰hh
(2)你的local node feature到底是什么??

节点特征是一个矩阵,然后里面的是特征表示。

这个数学表示是节点表示。
什么大领导啊???就算给通用表示也要说自己的实验里面用的什么吧
1.2. 论文框架图
2. 论文逐段精读
2.1. Abstract
①The authors emphasize the current fMRI classification models ignores non-imaging information and relationships between subjects or misidentify brain regions or biomarkers
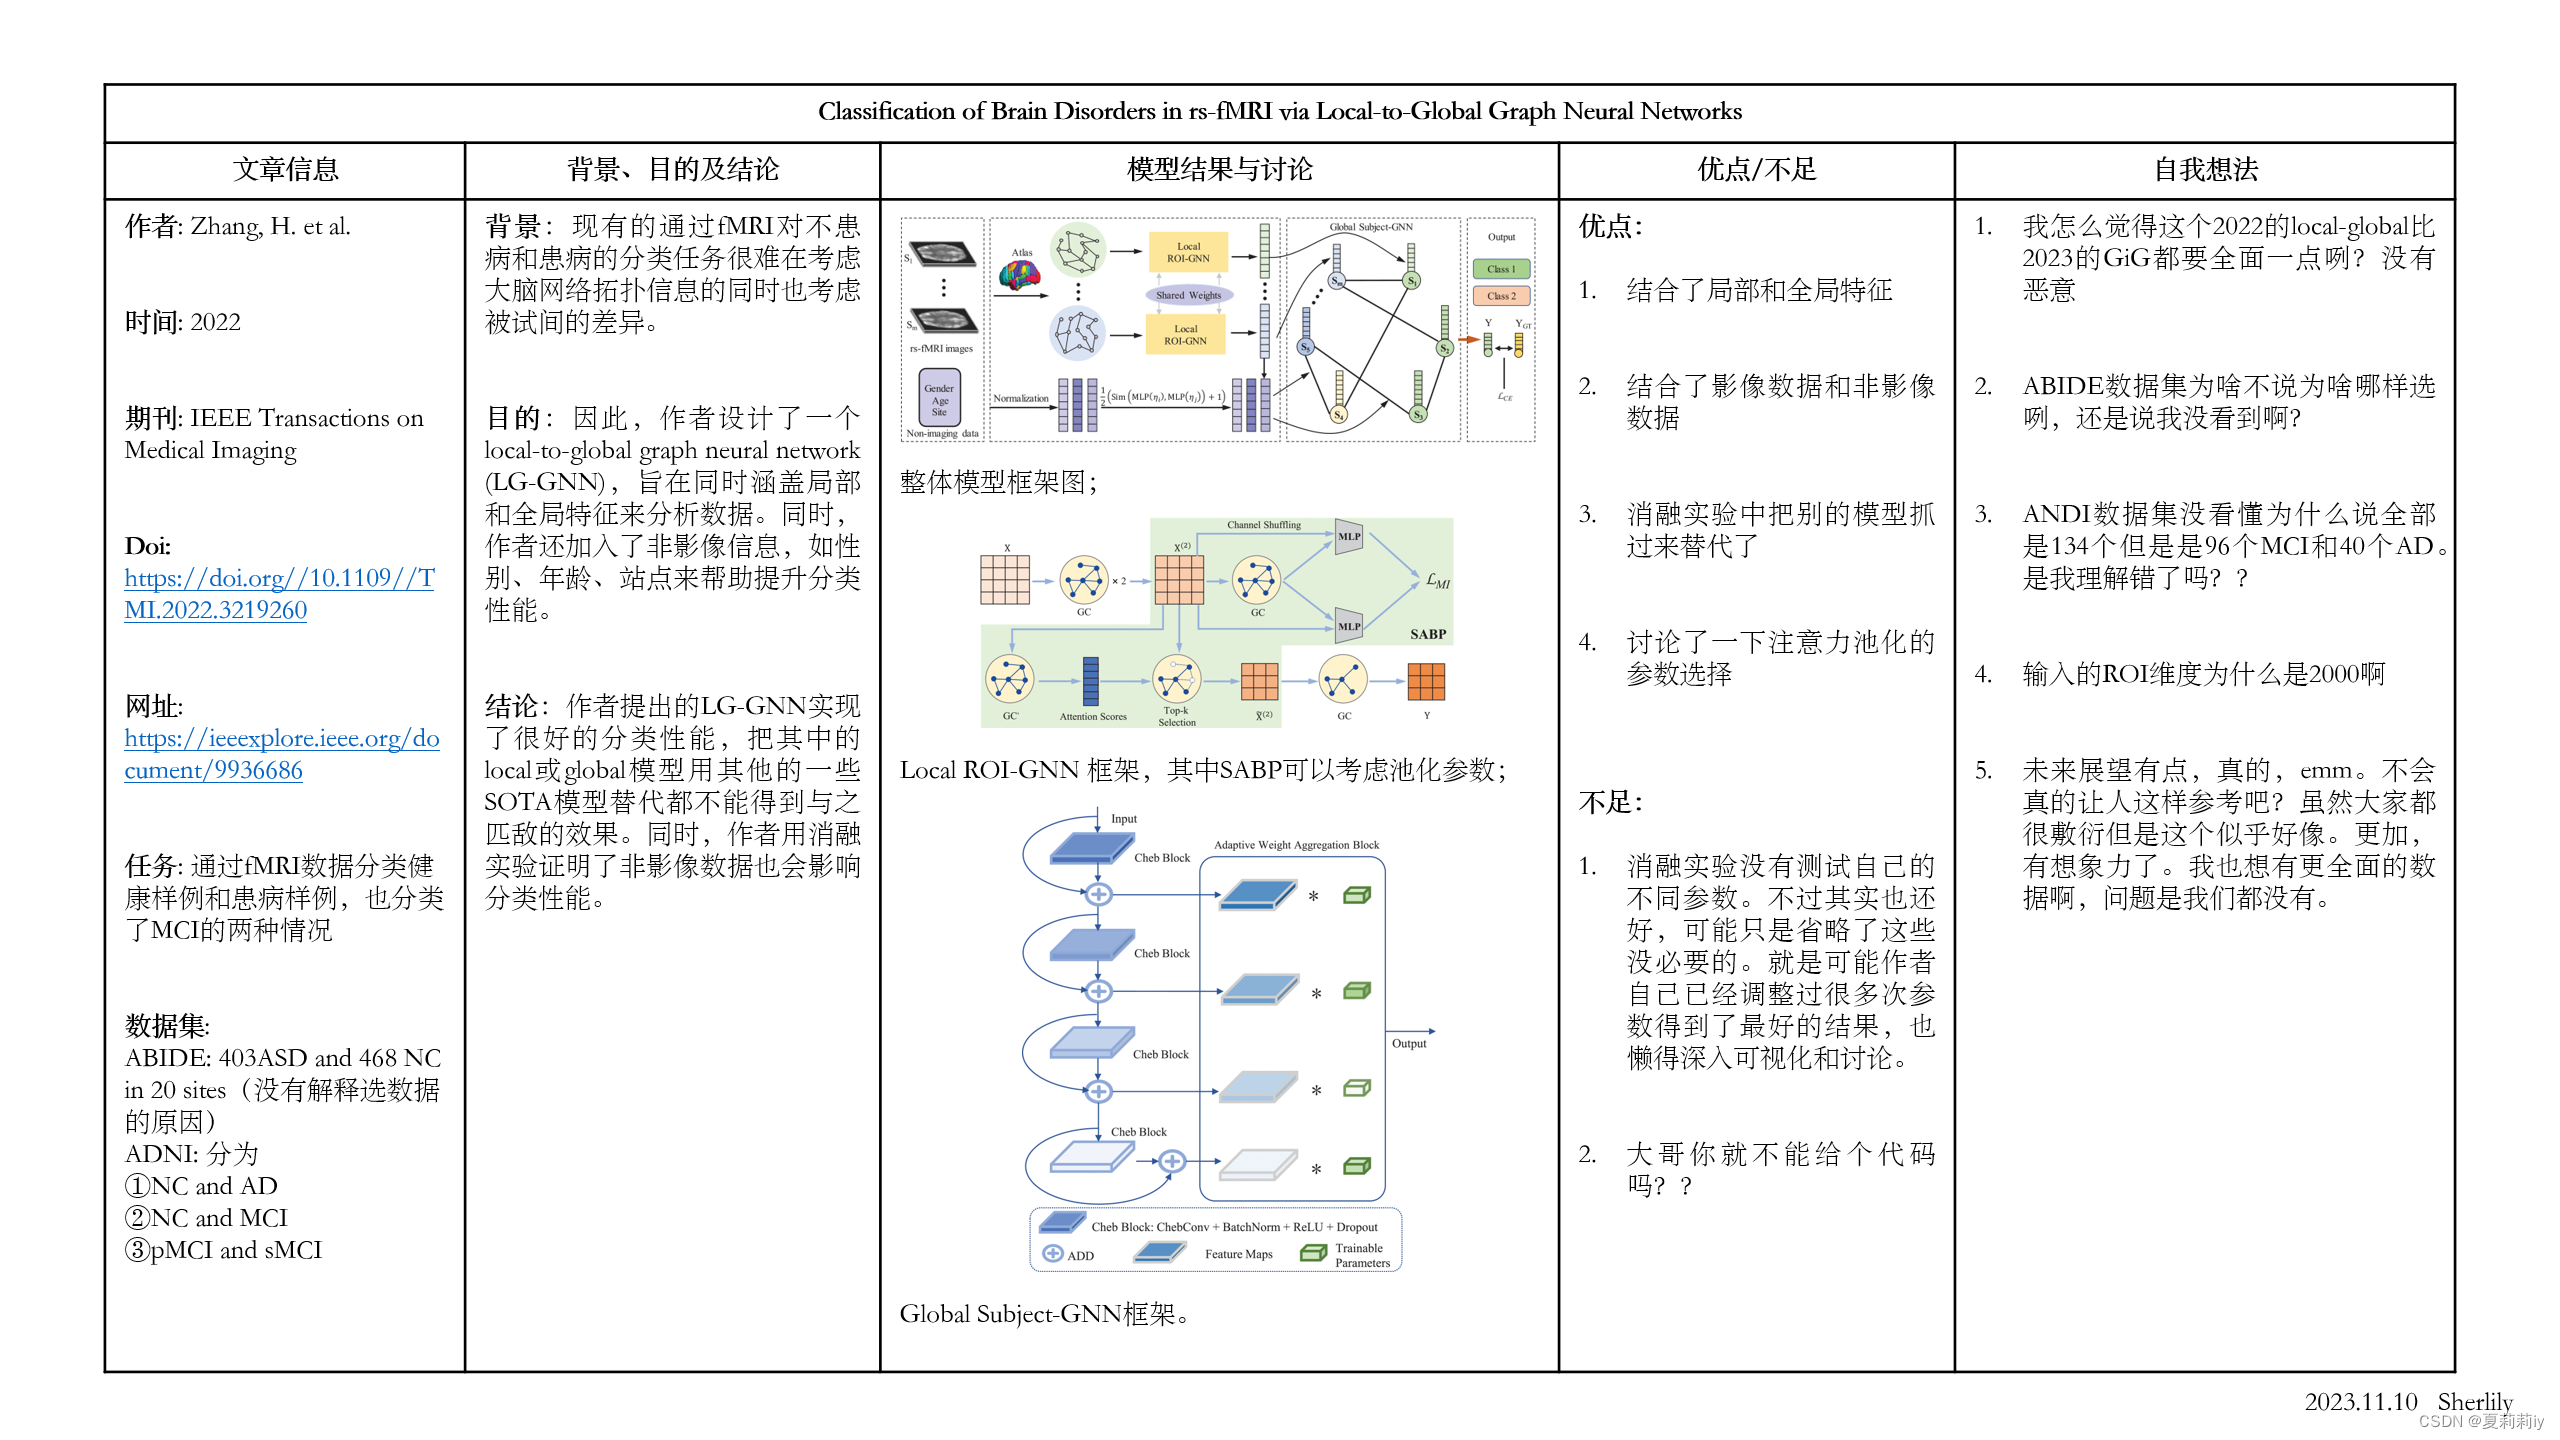
②Then, they put forward a local-to-global graph neural network (LG-GNN) to solve these problems
2.2. Introduction
①The diagnosis of Autism Spectrum Disorder (ASD) and Alzheimer’s disease (AD) is limited and inexperienced
②A Harvard-Oxford atlas maps of brain
③Graph neural networks (GNNs) has been found suitable for brain network analysis
④There are two types of GNN: regional brain graph and subject graph. The first one is good at local brain regions and biomarkers analysis, but ignores age, gender or relationships between subjects. And subject graph is just the opposite
⑤Therefore, they combine two methods to combine their advantages. They first adopt local, then expand to global
⑥Contribution: a) end to end LG-GNN, b) a pooling strategy based on an attention mechanism, c) excellent performances in 2 datasets
etiological adj.病因;病原学的,病原学的
aberrant adj.异常的;反常的;违反常规的
2.3. Related Work
2.3.1. Handcrafted Methods
①Functional connection construction by calculating Pearson correlation coefficient or "extracting weighted local clustering coefficients from the brain connectivity network from rs-fMRI, and then employed multiple-kernel based-SVM algorithm for the subsequent MCI classification"
②"Using SVM to classify AD from normal control (NC) after PCA and Student’s t-test for dimension reduction based on shape and diffusion tensor imaging"
③Also, different ROI may impact on the prediction accuracy
2.3.2. GNN-Based Methods
(1)GNNs Based on Regional Brain Graphs
Models such as DS-GCNs, s-GCN, MVS-GCN and mutual multi-scale triplet GCN etc. adopt regional graphs
(2)GNNs Based on Subject Graphs
Models such as GCN, InceptionGCN and SAC-GCN etc. adopt subject graphs
2.4. Proposed Method
①Framework of LG-GNN:
2.4.1. Local ROI-GNN
(1)Regional Brain Graph Construction
Approach of graph construction, each graph is represented as
:
(2)Local ROI-GNN Model
①Local ROI-GNN framework:
it consists of three graph convolution (GC) layers and the Self-Attention Based Pooling (SABP) module
②The activation in GC layer:
where denotes the degree matrix of
;
represents trainable weight matrix in the
-th layer;
is node representation.
③Receptive field: one hop neighborhoods
④For getting two-hops information, they adopt 2 GC layers. Then they get
(3)Self-Attention Based Pooling
①Pooling is essential in preserving and highlighting important ROI
②Transform to attention score
by
.
③Through , selecting the top-
nodes
④Then, follows a pooling layer (?) and a
⑤Finally, obtain new adjacency matrix
⑥They designed a loss to separate ROI weights
where is randomly shuffled
in channels (我也不知道有什么用啊).
⑦The output will be:
where
⑧我很想知道为什么作者说SABP可以考虑到拓扑关系啊,脑图不是无向图吗而且也不会有什么先后关系吧??
2.4.2. Global Subject-GNN
(1)Subject Graph Construction
①There are subjects, i.e.
vector
② is the adjacency matrix of
, where
is a binarized connectivity matrix of the combination of non-image information and information (with values greater than 0.4 becoming 1, and values less than 0.4 becoming 0)
③There is a similarity matrix , where
denotes the correlation distance,
is mean of
④Node similarity metric is constructed by non-image information
⑤
⑥Weight matrix , where
and
are both non-image information, Sim reperesents the cosine similarity, the 2 MLP layers share the same weights
(2)Global Subject-GNN Model
①A multi-scaled residual model was proposed as:
②Cheb conv is:
where looks like the eigenvalues of each node;
denotes a filter;
denotes parameter;
denotes convolution operator;
is come from Laplace matrix
;
③To save the calculating time, they approximate the above function to:
where is a rescaled Laplace graph,
denotes a learnable parameter
④The recursion might be ,
,
⑤Given the , there is
⑥The final embedding ,
where is learnable weight
;
denotes random initialized learnable weight;
(3)Total Training Loss
①They adopt cross entropy loss as the global loss:
②They combine local and global
to get total loss:
where the hyper parameter is set as 0.1
2.5. Materials and Classification Evaluation
2.5.1. Materials
They choose two datasets ABIDE, ADNI in 4 tasks:
(1)ABIDE Dataset
①They only select 871 samples from 1112 subjects with 403 ASD and 468 NC in 20 different sites.
②Preprocess pipeline: C-PAC
③Space: normalized in MNI152 space
(2)ADNI Dataset (NC and MCI)
①Preprocess: standard protocol
②Excluding significant artifacts or head movements beyond 2mm amplitude
③They choose 134 subjects with 96 MCI and 40 AD (不是,我有点不太理解这句话,40+96也不等于134吧?)
(3)ANDI Dataset (pMCI and sMCI)
①pMCI patients: deteriorating within 36 months; sMCI patients: do not deteriorate
②Atlas: Harvard-Oxford
③They choose 41 pMCI and 80 sMCI subjects excluding NaN data
④Preprocessing: standard procedures on GRETNA toolkit
2.5.2. Experimental Setting
①Optimizer: Adam
(1)Parameters of ABIDE
①Dropout rate: 0.3
②Learning rate: 0.01
③Maximum epochs: 400
④Non-image data: acquisition site, gender
(2)Parameters of ANDI
①Dropout rate:0.3
②Learning rate: 0.01
③Maximum epochs: 300
④Non-image data: gender and age
②Chebyshev polynomial order K: 3
③Cross-validation: 10-fold, 9 for training and 1 for test
④Evaluation metrics: classification accuracy (Acc), area under the curve (AUC), sensitivity (Sen) and F1-score
⑤这里的ROI Dimension是什么东西?为什么是2000,2140之类的?Non-imaging dimension denotes (number of subjects, binary classification)
2.6. Experimental Results
2.6.1. Classification Results on Different Datasets
(1)Classification Results on ABIDE
①Comparison with handcrafted methods: Ridge Classifier, SVM, Random Forest classifier
②Comparison with GNN-based methods: GCN, GAT, BrainGNN, MVS-GCN, PopulationGNN, InceptionGCN, EV-GCN, Hi-GCN
③Comparison with deep neural network (DNN) based methods
④The classification results (NI denotes whether adopting non-image data or not):
(2)Classification Results on ADNI (NC and MCI)
①Models in ANDI mostly outperform those in ABIDE in that data in ABIDE is highly heterogeneous (they come from different acquisition site)
②The classification results (NC and AD):
③The classification results on NC and MCI:
④The classification results on pMCI and sMCI:
2.6.2. Ablation Studies
(1)Ablation Study for Local ROI-GNN
①They compared local ROI-GNN with GAT, GIN, GraphSAGE, ChebNet, GCN, which means adopting these SOTA models in their model (replace local ROI-GNN)
②They found SABP module significantly enhances the performance. Specifically, they reckon appropriate pooling is vital. Excessive pooling may retain a lot of noise, but too small pooling may cause the topology information of the graph to be compressed. Thus, they choose 0.9 pooling rate.
③Replaced classification results:
④Different pooling rate in SABP module:
(2)Ablation Study for Global Subject-GNN
①They replaced subject-GNN by GATConv, GINConv, GraphSAGEConv, GCNConv
②Replaced classification results:
③To evaluate the effectiveness of AWAB module, they tried with or without (adopting output of the last Cheb block as the final output) AWAB in the table above
2.6.3. Biomarker Detection
①They obtain weights of ROI through SABP module, and select top 10 ROI as biomarker
②Mutual information loss is what they distinguish ROIs with putting important ROI weights to 1, other to 0
③The top 10 ROIs with the greatest impact on autism and Alzheimer's disease:
2.6.4. Discussion
①Acquisition site significantly affects the results, and gender impacts on classification as well in ABIDE dataset:
②Gender impacts more than age in ANDI:
③Other non-imaging data can also be used, such as IQ and genetic informatio(???你可以再写离谱一点吗我真的,这)
quotient n.商(除法所得的结果)
2.7. Conclusion
Their model LG-GNN with local and global modules achieve excellent performance
3. Reference List
Zhang, H. et al. (2022) 'Classification of Brain Disorders in rs-fMRI via Local-to-Global Graph Neural Networks', IEEE, vol. 42 (2), pp. 444-455. doi: 10.1109/TMI.2022.3219260


 被折叠的 条评论
为什么被折叠?
被折叠的 条评论
为什么被折叠?
 到【灌水乐园】发言


