QCustomplot基本使用 安装
进入官网下载最新版本下载QCustomplot ,解压后可直接引用源码,也可编译链接动态库。此例中实现基本折线图绘制、十字线、标记marker功能。 画折线图
打开Qt创建新工程,引用QCustomplot源码到工程中 工程.pro文件: QT += core gui opengl printsupport
DEFINES += QCUSTOMPLOT_USE_OPENGL
greaterThan(QT_MAJOR_VERSION, 4): QT += widgets
CONFIG += c++11
# You can make your code fail to compile if it uses deprecated APIs.
# In order to do so, uncomment the following line.
#DEFINES += QT_DISABLE_DEPRECATED_BEFORE=0x060000 # disables all the APIs deprecated before Qt 6.0.0
SOURCES += \
CMainPlot.cpp \
TestWidget.cpp \
main.cpp \
qcustomplot.cpp
HEADERS += \
CMainPlot.h \
TestWidget.h \
qcustomplot.h
FORMS += \
TestWidget.ui
# Default rules for deployment.
qnx: target.path = /tmp/$${TARGET}/bin
else: unix:!android: target.path = /opt/$${TARGET}/bin
!isEmpty(target.path): INSTALLS += target
#include "TestWidget.h"

#include <QApplication>

int main(int argc, char *argv[]) {
  QApplication a(argc, argv);
  TestWidget w;
  w.show();

  return a.exec();
}
#ifndef TEST_WIDGET_H
#define TEST_WIDGET_H

#include "CMainPlot.h"
#include <QTimer>
#include <QVector>
#include <QWidget>

QT_BEGIN_NAMESPACE
namespace Ui {
class TestWidget;
}
QT_END_NAMESPACE

class TestWidget : public QWidget {
  Q_OBJECT

public:
  TestWidget(QWidget *parent = nullptr);
  ~TestWidget();

private:
  Ui::TestWidget *ui;

  CMainPlot *plot_main_;
};
#endif // TEST_WIDGET_H
#include "TestWidget.h"
#include "ui_TestWidget.h"

TestWidget::TestWidget(QWidget *parent)
    : QWidget(parent), ui(new Ui::TestWidget) {
  ui->setupUi(this);

  plot_main_ = new CMainPlot();
  ui->horizontalLayout->addWidget(plot_main_);
}

TestWidget::~TestWidget() { delete ui; }
<?xml version="1.0" encoding="UTF-8"?>
<ui version="4.0">
 <class>TestWidget</class>
 <widget class="QWidget" name="TestWidget">
  <property name="geometry">
   <rect>
    <x>0</x>
    <y>0</y>
    <width>800</width>
    <height>600</height>
   </rect>
  </property>
  <property name="windowTitle">
   <string>Test Widget</string>
  </property>
  <layout class="QHBoxLayout" name="horizontalLayout"/>
 </widget>
 <resources/>
 <connections/>
</ui>
#ifndef MAIN_PLOT_DEF_H
#define MAIN_PLOT_DEF_H

#include "qcustomplot.h"
#include <QTimer>
#include <array>
#include <random>

#define X_DATA_COUNT 1000
#define Y_DATA_MAX_LIMIT 100

class CrossLine; // 十字线
class DrawTriangle; // 绘制倒三角形
class MarkerManager; // 绘制marker

class CMainPlot : public QWidget {
  Q_OBJECT
public:
  explicit CMainPlot(QWidget *parent = nullptr);

private:
  void Init();

  void SetXRange(double min, double max, const QString &name = "");
  void SetYRange(double min, double max, const QString &name = "");

  void CreateX(int size);
  void CreateY(int size, QVector<double> *ret);

private:
  QCustomPlot *plot_; // 作用类似画板
  QCPGraph *graph_selected_;  // marker依附的曲线标记
  CrossLine *cross_line_; // 十字线

  MarkerManager *draw_marker_; // marker

  QVector<double> vec_data_x_; // 模拟x轴数据
  QTimer update_data_timer_; // 模拟曲线数据定时器
};

class CrossLine : public QObject {
  Q_OBJECT
public:
  CrossLine(QCustomPlot *plot);

  void SetVisible(bool v);
  void CrossLineDraw(double x, double y);

private:
  void SetXLineCoords(double lx, double ly, double rx, double ry);
  void SetYLineCoords(double tx, double ty, double bx, double by);
  void SetTextCoords(double x, double y);
  void SetTextPixel(int x, int y);
  void SetText(const QString &xText, const QString &yText);

private:
  QCustomPlot *plot_;
  QCPItemLine *x_line_;  // 横线
  QCPItemLine *y_line_;  // 竖线
  QCPItemText *text_;    // 文本显示

  QPointF mouse_coords_;  // 记录鼠标坐标
};

class DrawMarker : public QObject {
  Q_OBJECT
public:
  DrawMarker(QCustomPlot *plot);

  void MarkerDraw(double x, double y);
  void SetVisible(bool v);
  void SetPixelPosition(double x, double y);
  bool IsVisible() const;

private:
  bool visible_;  // 是否可见
  QCustomPlot *plot_;
  QCPItemText *text_;  // mark文本

  DrawTriangle *triangle_; // 倒三角形
};

class MarkerManager : public QObject {
  Q_OBJECT
public:
  MarkerManager(QCustomPlot *plot);
  void ClearMarker();
  void MarkerDraw(double xpos, double ypos, QCPGraph *graph);
  void UpdateMarker();

private:
  QCustomPlot *plot_;
  std::array<DrawMarker *, 5> array_marker_; // marker数组,最多绘制5个
  std::array<QCPItemTracer *, 5> array_tracer_; // marker依附曲线数组,数据寻峰
  std::array<QPointF, 5> array_mouse_pos_;   // 记录鼠标位置

  int marker_count_;  // 绘制marker的索引
};

class DrawTriangle : public QCPAbstractItem {
  Q_OBJECT
public:
  DrawTriangle(QCustomPlot *plot);

  void TriangleDraw(double x, double y);
  void SetVisible(bool v);

private:
  void SetMouseCoords(double x, double y);

  // reimplemented virtual methods:
  virtual double selectTest(const QPointF &pos, bool onlySelectable, QVariant *details = nullptr) const Q_DECL_OVERRIDE;

  virtual void draw(QCPPainter *painter) Q_DECL_OVERRIDE;

private:
  QCustomPlot *plot_;
  QPointF mouse_coords_;  // 记录鼠标坐标
};

#endif // MAIN_PLOT_DEF_H
#include "CMainPlot.h"
#include <QHBoxLayout>

CMainPlot::CMainPlot(QWidget *parent) : QWidget(parent) {
  Init();
  update_data_timer_.setInterval(40);

  CreateX(X_DATA_COUNT);
  connect(&update_data_timer_, &QTimer::timeout, [this] {
    static QVector<double> vec_data_y;
    CreateY(X_DATA_COUNT, &vec_data_y);
    plot_->graph(0)->setData(vec_data_x_, vec_data_y);
    CreateY(X_DATA_COUNT, &vec_data_y);
    plot_->graph(1)->setData(vec_data_x_, vec_data_y);
    draw_marker_->UpdateMarker();
    plot_->replot();
  });
  update_data_timer_.start();
  this->resize(800, 600);

  QHBoxLayout *hbox = new QHBoxLayout;
  hbox->addWidget(plot_);
  this->setLayout(hbox);

  draw_marker_ = new MarkerManager(plot_);
}

void CMainPlot::SetXRange(double min, double max, const QString &name) {
  plot_->xAxis->setRange(min, max);
  plot_->xAxis->setLabel(name);
}

void CMainPlot::SetYRange(double min, double max, const QString &name) {
  plot_->yAxis->setRange(min, max);
  plot_->yAxis->setLabel(name);
}

void CMainPlot::CreateX(int size) {
  for (int i = 0; i < size; ++i) {
    vec_data_x_.push_back(i);
  }
}

void CMainPlot::CreateY(int size, QVector<double> *ret) {
  ret->resize(size);
  std::random_device rd;
  std::default_random_engine e(rd());
  std::uniform_int_distribution<int> uniform_dist(1, Y_DATA_MAX_LIMIT);

  for (int i = 0; i < size; ++i) {
    (*ret)[i] = uniform_dist(e);
  }
}

void CMainPlot::Init() {
  plot_ = new QCustomPlot(this);
  plot_->setInteractions(QCP::iRangeZoom | QCP::iSelectPlottables);

  SetXRange(0, X_DATA_COUNT, "X");
  SetYRange(0, Y_DATA_MAX_LIMIT + 10, "Y");

  //  plot_->legend->setVisible(true);
  //  plot_->legend->setTextColor(Qt::blue);
  plot_->setOpenGl(true);

  plot_->addGraph();
  plot_->graph(0)->setPen(QPen(Qt::red));
  plot_->graph(0)->setName("red color");

  plot_->addGraph();
  plot_->graph(1)->setPen(QPen(Qt::green));
  plot_->graph(1)->setName("green color");
  plot_->replot();

  cross_line_ = new CrossLine(plot_);
  cross_line_->SetVisible(true);

  graph_selected_ = nullptr;

  connect(plot_, &QCustomPlot::selectionChangedByUser, [this] {
    for (int i = 0; i < plot_->graphCount(); ++i) {
      if (!plot_->graph(i)->selected())
        continue;

      graph_selected_ = plot_->graph(i);
      break;
    }
  });

  connect(plot_, &QCustomPlot::mouseMove, [this](QMouseEvent *event) {
    double x = plot_->xAxis->pixelToCoord(event->pos().x());
    double y = plot_->yAxis->pixelToCoord(event->pos().y());
    cross_line_->CrossLineDraw(x, y);
    plot_->replot();
  });

  connect(plot_, &QCustomPlot::mouseDoubleClick, [this](QMouseEvent *event) {
    if (graph_selected_ == nullptr)
      return;
    draw_marker_->MarkerDraw(event->pos().x(), event->pos().y(),
                             graph_selected_);
    plot_->replot();
  });
}

CrossLine::CrossLine(QCustomPlot *plot) : QObject(nullptr), plot_(plot) {
  assert(plot != nullptr);

  QPen pen;
  pen.setWidthF(1.3);
  pen.setColor(Qt::blue);

  x_line_ = new QCPItemLine(plot_);
  x_line_->setPen(pen);
  x_line_->setSelectable(false);

  y_line_ = new QCPItemLine(plot_);
  y_line_->setPen(pen);
  y_line_->setSelectable(false);

  text_ = new QCPItemText(plot_);
  text_->setPen(pen);
  text_->setColor(Qt::blue);
  text_->setSelectable(false);
  SetVisible(false);
}

void CrossLine::SetVisible(bool v) {
  x_line_->setVisible(v);
  y_line_->setVisible(v);
  text_->setVisible(v);
}

void CrossLine::CrossLineDraw(double x, double y) {
  mouse_coords_.setX(x);
  mouse_coords_.setY(y);

  double l = plot_->xAxis->pixelToCoord(plot_->rect().topLeft().x());
  double r = plot_->xAxis->pixelToCoord(plot_->rect().topRight().x());
  SetXLineCoords(l, y, r, y);

  l = plot_->yAxis->pixelToCoord(plot_->rect().topLeft().y());
  r = plot_->yAxis->pixelToCoord(plot_->rect().bottomRight().y());
  SetYLineCoords(x, l, x, r);

  l = plot_->xAxis->coordToPixel(x);
  r = plot_->yAxis->coordToPixel(y);
  SetTextPixel(l + 40, r - 20);
  SetText(QString("X: %1").arg(x), QString("Y: %1").arg(y));
}

void CrossLine::SetXLineCoords(double lx, double ly, double rx, double ry) {
  x_line_->start->setCoords(lx, ly);
  x_line_->end->setCoords(rx, ry);
}

void CrossLine::SetYLineCoords(double tx, double ty, double bx, double by) {
  y_line_->start->setCoords(tx, ty);
  y_line_->end->setCoords(bx, by);
}

void CrossLine::SetTextCoords(double x, double y) {
  text_->position->setCoords(x, y);
}

void CrossLine::SetTextPixel(int x, int y) {
  text_->position->setPixelPosition(QPointF(x, y));
}

void CrossLine::SetText(const QString &xText, const QString &yText) {
  text_->setText(QString("%1\n%2").arg(xText).arg(yText));
}

DrawMarker::DrawMarker(QCustomPlot *plot) : QObject(nullptr), plot_(plot) {
  assert(plot != nullptr);

  text_ = new QCPItemText(plot_);
  text_->setTextAlignment(Qt::AlignmentFlag::AlignLeft);
  //  text_->setColor(QColor(Qt::green));
  triangle_ = new DrawTriangle(plot_);
}

void DrawMarker::SetPixelPosition(double x, double y) {
  text_->position->setPixelPosition(QPointF(x, y));
}

bool DrawMarker::IsVisible() const { return visible_; }

void DrawMarker::MarkerDraw(double x, double y) {
  triangle_->TriangleDraw(x, y);
  text_->setText(QString("X: %1, Y: %2").arg(x).arg(y));
}

void DrawMarker::SetVisible(bool v) {
  visible_ = v;
  triangle_->SetVisible(v);
  text_->setVisible(v);
}

DrawTriangle::DrawTriangle(QCustomPlot *plot)
    : QCPAbstractItem(plot), plot_(plot) {

  assert(plot != nullptr);
  SetVisible(false);
}

void DrawTriangle::TriangleDraw(double x, double y) {
  SetVisible(true);
  SetMouseCoords(x, y);
}

void DrawTriangle::SetVisible(bool v) { this->setVisible(v); }

void DrawTriangle::SetMouseCoords(double x, double y) {
  mouse_coords_.setX(x);
  mouse_coords_.setY(y);
}

double DrawTriangle::selectTest(const QPointF &pos, bool onlySelectable,
                                QVariant *details) const {
  Q_UNUSED(details)
  Q_UNUSED(pos)
  if (onlySelectable && !mSelectable)
    return -1;
  return -1;
}

/* inherits documentation from base class */
void DrawTriangle::draw(QCPPainter *painter) {

  painter->save();
  painter->setPen(Qt::red); //画笔
  painter->setBrush(Qt::red);

  double x = plot_->xAxis->coordToPixel(mouse_coords_.x());
  double y = plot_->yAxis->coordToPixel(mouse_coords_.y());

  QPainterPath path;
  // Set pen to this point.
  path.moveTo(x - 10, y - 10);
  // Draw line from pen point to this point.
  path.lineTo(x + 10, y - 10);

  path.moveTo(x + 10, y - 10);
  path.lineTo(x, y);

  path.moveTo(x, y);
  path.lineTo(x - 10, y - 10);

  painter->fillPath(path, QBrush(Qt::red));
  painter->drawPath(path);
  painter->restore();
}

MarkerManager::MarkerManager(QCustomPlot *plot)
    : QObject(nullptr), plot_(plot) {
  assert(plot != nullptr);
  for (size_t i = 0; i < array_marker_.size(); ++i) {
    array_marker_[i] = new DrawMarker(plot_);
    array_marker_[i]->SetVisible(false);
    array_tracer_[i] = new QCPItemTracer(plot_);
    array_tracer_[i]->setVisible(false);
    array_tracer_[i]->setInterpolating(true);
  }

  marker_count_ = 0;
}

void MarkerManager::ClearMarker() {
  marker_count_ = 0;

  for (size_t i = 0; i < array_marker_.size(); ++i) {
    array_marker_[i]->SetVisible(false);
  }
}

void MarkerManager::MarkerDraw(double xpos, double ypos, QCPGraph *graph) {
  double x = plot_->xAxis->pixelToCoord(xpos);
  double y = plot_->yAxis->pixelToCoord(ypos);
  array_marker_[marker_count_]->SetVisible(true);
  array_mouse_pos_[marker_count_] = QPointF(xpos, ypos);

  QPoint pt = plot_->rect().topRight();
  array_marker_[marker_count_]->SetPixelPosition(
      pt.x() - 110, pt.y() + 20 * (marker_count_ + 1));

  array_marker_[marker_count_]->MarkerDraw(x, y);

  if (graph) {
    array_tracer_[marker_count_]->setGraph(graph);
    array_tracer_[marker_count_]->setGraphKey(x);
    array_tracer_[marker_count_]->updatePosition();
  }

  marker_count_ = (++marker_count_) % array_marker_.size();
}

void MarkerManager::UpdateMarker() {

  double low = plot_->xAxis->range().lower;
  double up = plot_->xAxis->range().upper;
  int start = 0;
  int end = 0;
  double offset = 0.0;

  double x = 0.0;
  double y = 0.0;
  double pos = 0.0;
  for (size_t i = 0; i < array_mouse_pos_.size(); ++i) {
    if (!array_marker_[i]->IsVisible())
      continue;

    x = plot_->xAxis->pixelToCoord(array_mouse_pos_[i].x());
    y = plot_->yAxis->pixelToCoord(array_mouse_pos_[i].y());

    if (array_tracer_[i]->graph() == nullptr)
      continue;

    pos = array_tracer_[i]->graph()->dataCount() * ((x - low) / (up - low));

    offset = array_tracer_[i]->graph()->dataCount() * 0.005;

    start = pos - offset > 0 ? pos - offset : 0;
    end = pos + offset > array_tracer_[i]->graph()->dataCount()
              ? array_tracer_[i]->graph()->dataCount()
              : pos + offset;

    double max = array_tracer_[i]->graph()->dataMainValue(start);
    int index = start;
    for (int n = start + 1; n < end; ++n) {
      if (array_tracer_[i]->graph()->dataMainValue(n) < max)
        continue;

      index = n;
      max = array_tracer_[i]->graph()->dataMainValue(n);
    }

    array_tracer_[marker_count_]->setGraphKey(
        array_tracer_[i]->graph()->dataMainKey(index));
    array_tracer_[marker_count_]->updatePosition();
    array_marker_[i]->MarkerDraw(array_tracer_[i]->graph()->dataMainKey(index),  max);
  }
}
图例 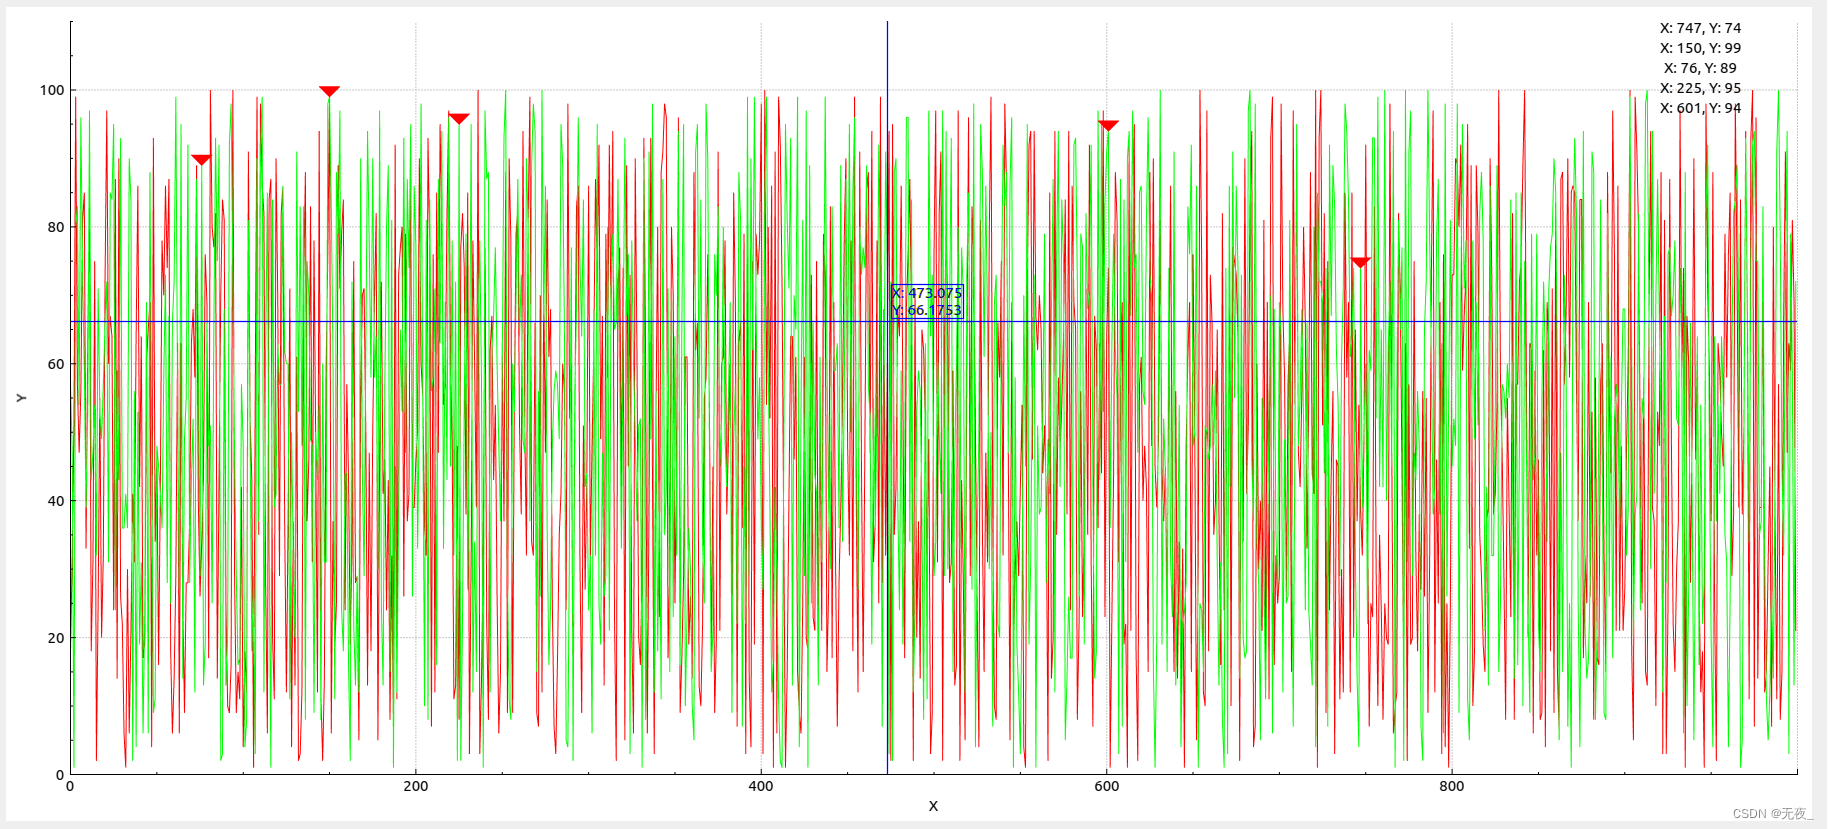
运行图例
起始


 450
450

 被折叠的 条评论
为什么被折叠?
被折叠的 条评论
为什么被折叠?
 到【灌水乐园】发言


