void Widget::InitQLineXTimeAddData()
{
customPlot = new QCustomPlot();
QSharedPointer<QCPAxisTickerDateTime> dateTimeTicker(new QCPAxisTickerDateTime);
dateTimeTicker->setDateTimeFormat("hh:mm"); // 设置时间格式为小时:分钟
customPlot->xAxis->setTickLabelRotation(45); // 设置刻度标签旋转角度,以便更好地显示
customPlot->xAxis->setTicker(dateTimeTicker);
// 设置X轴的范围从00:00到23:59
QDateTime startTime = QDateTime::fromString("00:00", "hh:mm");
QDateTime endTime = QDateTime::fromString("23:59", "hh:mm");
customPlot->xAxis->setRange(startTime.toMSecsSinceEpoch()/1000.0, endTime.toMSecsSinceEpoch()/1000.0);
// 动态生成X轴的刻度
int numHours = startTime.secsTo(endTime) / 3600 + 1; //计算时间范围内的小时数
// 设置 tickCount 为时间范围内的小时数
dateTimeTicker->setTickCount(numHours);
// 添加并设置两个图形的pen
QCPGraph *graph1 = customPlot->addGraph();
graph1->setPen(QPen(Qt::blue));
QCPGraph *graph2 = customPlot->addGraph();
graph2->setPen(QPen(Qt::red));
// 设置图例
customPlot->legend->setVisible(true);
graph1->setName("A产品");
graph2->setName("B产品");
customPlot->axisRect()->insetLayout()->setInsetAlignment(0,Qt::AlignTop|Qt::AlignRight);
graph1->setLineStyle(QCPGraph::lsLine); // 实线
graph1->setScatterStyle(QCPScatterStyle(QCPScatterStyle::ssDisc, QColor(Qt::blue), 6)); // 圆形散点
graph2->setLineStyle(QCPGraph::lsLine); // 实线
graph2->setScatterStyle(QCPScatterStyle(QCPScatterStyle::ssDisc, 6)); // 圆形散点
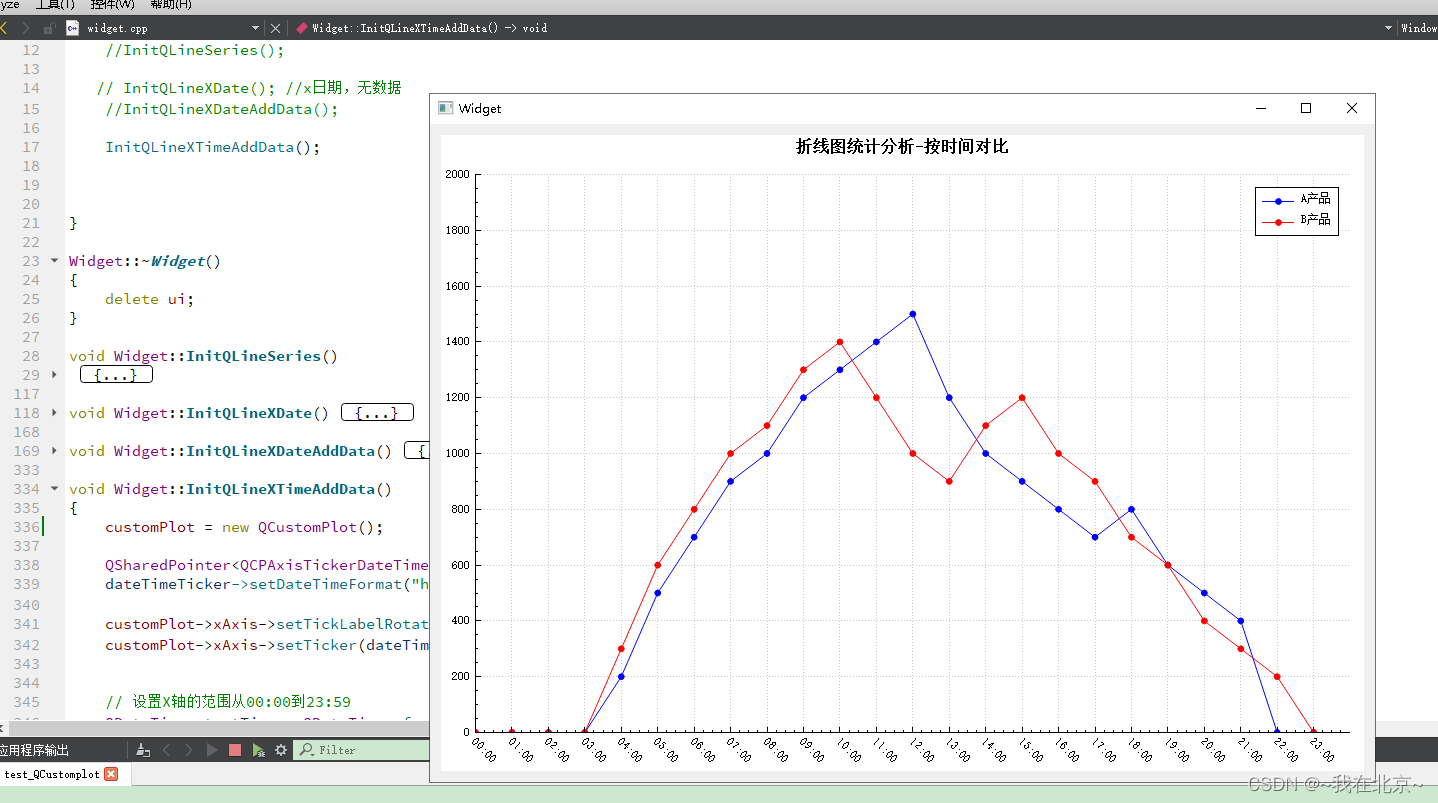
QVector<QString> timeKey = {"00:00","01:00","02:00","03:00","04:00","05:00", "06:00", "07:00", "08:00", "09:00","10:00", "11:00","12:00", "13:00","14:00","15:00", "16:00", "17:00", "18:00", "19:00","20:00","21:00","22:00","23:00"};
QVector<double> dataValuesA = {0, 0, 0, 0, 200, 500, 700, 900, 1000, 1200, 1300, 1400, 1500, 1200, 1000, 900, 800, 700, 800, 600, 500, 400, 0,0};
QVector<double> dataValuesB = {0, 0, 0, 0, 300, 600, 800, 1000, 1100, 1300, 1400, 1200, 1000, 900, 1100, 1200, 1000, 900, 700, 600, 400, 300, 200,0};
for (int i = 0; i < timeKey.size(); ++i) {
QDateTime time = QDateTime::fromString(timeKey[i], "hh:mm");
if (!time.isValid()) {
qDebug() << "Invalid time format at index" << i;
continue;
}
double xValueA = time.toMSecsSinceEpoch() / 1000.0;
double yValueA = dataValuesA[i];
// 添加数据到第一个图形
graph1->addData(xValueA, yValueA);
}
for (int i = 0; i < timeKey.size(); ++i) {
QDateTime time = QDateTime::fromString(timeKey[i], "hh:mm");
if (!time.isValid()) {
qDebug() << "Invalid time format at index" << i;
continue;
}
double xValueA = time.toMSecsSinceEpoch() / 1000.0;
double yValueB = dataValuesB[i];
// 添加数据到第二个图形
graph2->addData(xValueA, yValueB);
}
// 整个折线图标题
QCPTextElement* PlotTitle = new QCPTextElement(customPlot, "折线图统计分析-按时间对比");
//PlotTitle->setPositionAlignment(Qt::AlignCenter);
PlotTitle->setFont(QFont("宋体", 12, QFont::Bold)); // 设置标题的字体
customPlot->plotLayout()->insertRow(0); // 在图表布局中插入一行
customPlot->plotLayout()->addElement(0, 0, PlotTitle); // 将标题添加到插入的行
// 设置Y轴范围为0-2000
customPlot->yAxis->setRange(0, 2000);
customPlot->yAxis->ticker()->setTickCount(10);
customPlot->setGeometry(QRect(10,20,700,600));
customPlot->replot();
QVBoxLayout* pVBoxLayout = new QVBoxLayout(this);
pVBoxLayout->addWidget(customPlot);
}


 590
590


 被折叠的 条评论
为什么被折叠?
被折叠的 条评论
为什么被折叠?
 到【灌水乐园】发言


