


 本文介绍如何使用tight_subplot函数和tiledlayout功能来调整MATLAB绘图中子图的间距和边缘距离,帮助读者创建更紧凑布局。通过实例演示了如何自定义间隙和边距,适用于Matlab2019b及以上版本。
Matlab子图间距和边缘距离调整
MATLAB绘图,尤其是绘制多子图时,会在周围留下许多空白,子图的间距有时也需要更改,但是subplot并没有提供这个功能,手动修改太过麻烦。
一共有两种方法可以解决这个问题
(1)使用tight_subplot函数,替代subplot进行绘图设置。
(2)matlab2019b及以后版本,tiledlayout函数也可以实现减小空白区域的功能
1.tight_subplot函数
函数的源码参考这个链接:https://www.mathworks.com/matlabcentral/fileexchange/27991-tight_subplot-nh-nw-gap-marg_h-marg_w 用起来也是十分方便的。
如果你下载不下来,这里把源码贴出来,你自己创建一个.m文件就行了。
function [ha, pos] = tight_subplot(Nh, Nw, gap, marg_h, marg_w)

% tight_subplot creates "subplot" axes with adjustable gaps and margins
%
% [ha, pos] = tight_subplot(Nh, Nw, gap, marg_h, marg_w)
%
%   in:  Nh      number of axes in hight (vertical direction)
%        Nw      number of axes in width (horizontaldirection)
%        gap     gaps between the axes in normalized units (0...1)
%                   or [gap_h gap_w] for different gaps in height and width
%        marg_h  margins in height in normalized units (0...1)
%                   or [lower upper] for different lower and upper margins
%        marg_w  margins in width in normalized units (0...1)
%                   or [left right] for different left and right margins
%
%  out:  ha     array of handles of the axes objects
%                   starting from upper left corner, going row-wise as in
%                   subplot
%        pos    positions of the axes objects
%
%  Example: ha = tight_subplot(3,2,[.01 .03],[.1 .01],[.01 .01])
%           for ii = 1:6; axes(ha(ii)); plot(randn(10,ii)); end
%           set(ha(1:4),'XTickLabel',''); set(ha,'YTickLabel','')

% Pekka Kumpulainen 21.5.2012   @tut.fi
% Tampere University of Technology / Automation Science and Engineering


if nargin<3; gap = .02; end
if nargin<4 || isempty(marg_h); marg_h = .05; end
if nargin<5; marg_w = .05; end

if numel(gap)==1;
    gap = [gap gap];
end
if numel(marg_w)==1;
    marg_w = [marg_w marg_w];
end
if numel(marg_h)==1;
    marg_h = [marg_h marg_h];
end

axh = (1-sum(marg_h)-(Nh-1)*gap(1))/Nh;
axw = (1-sum(marg_w)-(Nw-1)*gap(2))/Nw;

py = 1-marg_h(2)-axh;

% ha = zeros(Nh*Nw,1);
ii = 0;
for ih = 1:Nh
    px = marg_w(1);

    for ix = 1:Nw
        ii = ii+1;
        ha(ii) = axes('Units','normalized', ...
            'Position',[px py axw axh], ...
            'XTickLabel','', ...
            'YTickLabel','');
        px = px+axw+gap(2);
    end
    py = py-axh-gap(1);
end
if nargout > 1
    pos = get(ha,'Position');
end
ha = ha(:);
函数调用格式为:
[ha,pos]=tight_subplot(Nh,Nw,gap,marg_h,marg_w)
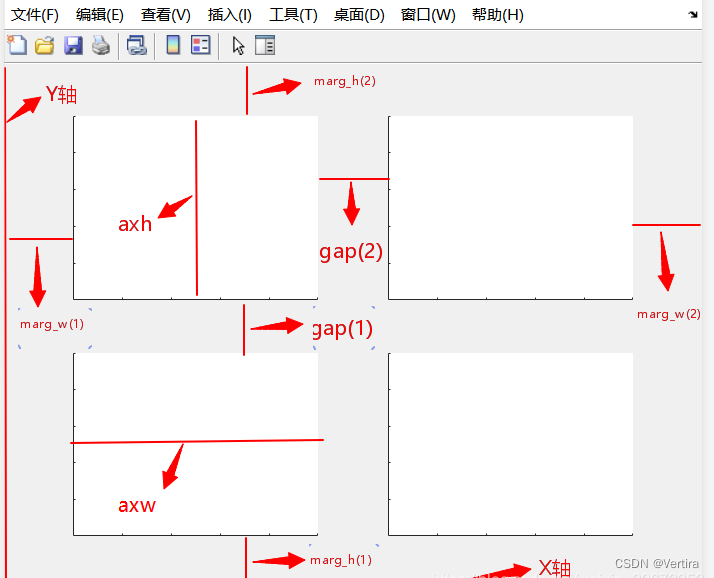
% ha 是坐标轴句柄,pos是每个坐标轴的原点与长宽
% Nh,Nw 可以认为是几行几列
% gap是子图的纵向和横向间距,gap(1)为纵向,gap(2)为横向
% marg_h是图件与上下边缘的距离,marg_h(1)为距下边缘的距离,marg_h(2)是距上边缘的距离
% marg_w 是图件与左右边缘的距离,marg_w(1)为距左边缘的距离,marg_w(2)是距右边缘的距离。
相关参数可见下图示意
应用示例:
ha = tight_subplot(3,2,[.01 .03],[.1 .01],[.01 .01])
 for ii = 1:6; axes(ha(ii)); plot(randn(10,ii)); end
 set(ha(1:4),'XTickLabel',''); set(ha,'YTickLabel','')
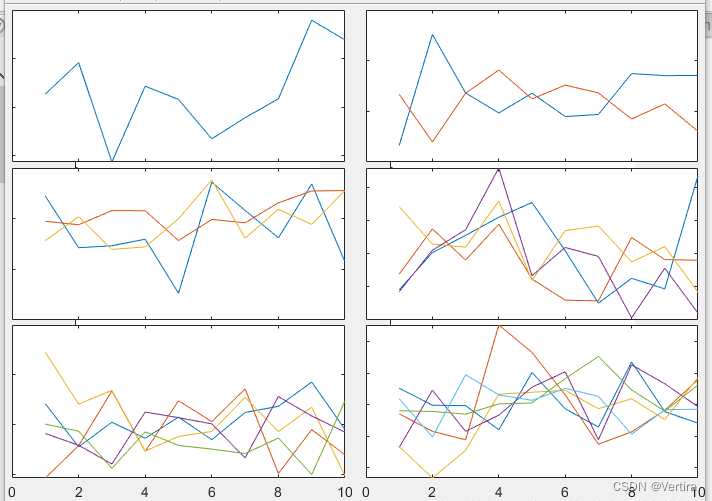
可以很明显的看出间距的调整,可以自定义gap、marg_h、marg_w的参数,找到适合自己的间距。
- matlab2019b以后的版本有tiledlayout


 4万+
4万+

 被折叠的 条评论
为什么被折叠?
被折叠的 条评论
为什么被折叠?
 到【灌水乐园】发言


