linux性能优化perf

目录

perf stat 对全局性能进程统计

perf top 显示最多的函数或指令

perf record 精确到函数

火焰图FlameGraph


perf是Linux性能分析工具

perf工具学习链接

perf stat 对全局性能进程统计

(base) root@ubuntu:/home/wy# perf stat ls
anaconda3  Desktop  Documents  Downloads  examples.desktop  misc  Music  network  Pictures  process  Public  PycharmProjects  qt_code  snap  Templates	video1.avi  Videos  visual-studio-code	vm_test

 Performance counter stats for 'ls':

              0.68 msec task-clock                #    0.142 CPUs utilized          
                 1      context-switches          #    0.001 M/sec                  
                 0      cpu-migrations            #    0.000 K/sec                  
                97      page-faults               #    0.143 M/sec                  
   <not supported>      cycles                                                      
   <not supported>      instructions                                                
   <not supported>      branches                                                    
   <not supported>      branch-misses                                               

       0.004774876 seconds time elapsed

       0.000957000 seconds user
       0.000000000 seconds sys
  • task-clock:任务占用的CPU时间
  • context-switches:上下文切换次数
  • cpu-migrations:CPU迁移次数
  • page-faults:缺页异常的次数
  • cycles:消耗CPU周期数
  • instructions:执行指令数
  • branches:遇到的分支指令数量
  • branches-misses:预测错误的分支指令数

perf top 显示最多的函数或指令

watermark,type_d3F5LXplbmhlaQ,shadow_50,text_Q1NETiBA5Li65LqG57u05oqk5LiW55WM5ZKM5bmzXw==,size_20,color_FFFFFF,t_70,g_se,x_16

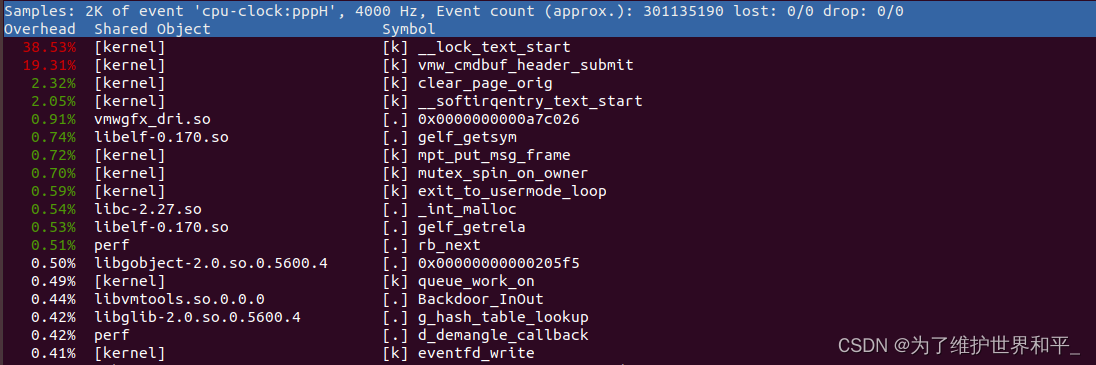
 perf top主要用于实时分析每个函数在某个性能事件上的热度,能够快速定位函数(应用程序函数、模块函数、内核函数)

  • 第一列:符号引发的性能事件的比例,默认情况占用CPU周期比例
  • 第二列:符号引发的BSO,可以是内核,动态链接库、模块、应用程序;
  • 第三列:BSO的类型,(. 符号属于用户态的ELF文件,k符号属于内核或模块)
  • 第四列:有些符号不能解析为函数名,只用地址表示

perf record 精确到函数

perf record -a -g ./test2

选项

  • -a 获取所有CPU事件
  • -p 获取指定PID进程事件
  • -o 指定获取保存数据的文件名称
  • -g 函数调用功能图

sudo perf report -i perf.data > perf.txt

函数调用情况,CPU大部分花在 test2  for_loop函数上

# To display the perf.data header info, please use --header/--header-only options.
#
#
# Total Lost Samples: 0
#
# Samples: 52K of event 'cpu-clock:pppH'
# Event count (approx.): 13062750000
#
# Children      Self  Command  Shared Object      Symbol                                        
# ........  ........  .......  .................  ..............................................
#
   100.00%     1.70%  test2    test2              [.] for_loop
            |          
            |--98.30%--for_loop
            |          |          
            |          |--50.78%--__cos_fma
            |          |          |          
            |          |          |--41.69%--do_sincos_1 (inlined)
            |          |          |          |          
            |          |          |          |--13.04%--do_cos (inlined)
            |          |          |          |          
            |          |          |          |--11.27%--do_sin (inlined)
            |          |          |          |          
            |          |          |          |--4.19%--__copysign (inlined)
            |          |          |          |          
            |          |          |          |--1.13%--sloww1 (inlined)
            |          |          |          |          |          
            |          |          |          |           --0.83%--do_sin_slow (inlined)
            |          |          |          |          
            |          |          |           --0.76%--sloww2 (inlined)
            |          |          |          
            |          |          |--2.28%--libc_feholdsetround_sse_ctx (inlined)
            |          |          |          
            |          |           --1.24%--reduce_sincos_1 (inlined)
            |          |          
            |          |--46.72%--__sin_fma
            |          |          |          
            |          |          |--36.81%--do_sincos_1 (inlined)
            |          |          |          |          
            |          |          |          |--12.48%--do_cos (inlined)
            |          |          |          |          
            |          |          |          |--11.13%--do_sin (inlined)
            |          |          |          |          
            |          |          |          |--3.17%--__copysign (inlined)
            |          |          |          |          
            |          |          |           --0.55%--sloww1 (inlined)
            |          |          |          
            |          |          |--2.00%--reduce_sincos_1 (inlined)
            |          |          |          
            |          |           --1.59%--libc_feholdsetround_sse_ctx (inlined)
            |          |          
            |           --0.56%--sin@plt
            |          
             --1.70%--_start
                       __libc_start_main
                       main
                       |          
                        --1.41%--loop_big
                                  for_loop

火焰图FlameGraph

用于展示 CPU 的调用栈

需要下载FlameGraph, 并需要perf.data文件

#生成折叠后的调用栈
perf script -i perf.data &> perf.unfold
 
#生成火焰图
./FlameGraph/stackcollapse-perf.pl perf.unfold &> perf.folded

#生成SVG图
./FlameGraph/flamegraph.pl  perf.folded >perf.svg

watermark,type_d3F5LXplbmhlaQ,shadow_50,text_Q1NETiBA5Li65LqG57u05oqk5LiW55WM5ZKM5bmzXw==,size_20,color_FFFFFF,t_70,g_se,x_16

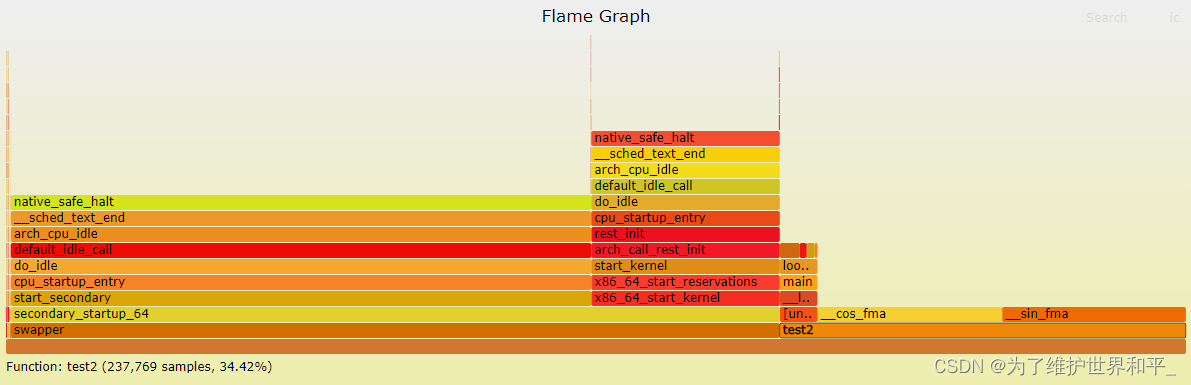
纵向表示调用栈的深度,横向表示消耗的时间. 一个格子的越大越说明其可能是瓶颈,颜色则没有含义。


Linux perf Examples

  • 2
    点赞
  • 8
    收藏
    觉得还不错? 一键收藏
  • 打赏
    打赏
  • 0
    评论

“相关推荐”对你有帮助么?

  • 非常没帮助
  • 没帮助
  • 一般
  • 有帮助
  • 非常有帮助
提交
评论
添加红包

请填写红包祝福语或标题

红包个数最小为10个

红包金额最低5元

当前余额3.43前往充值 >
需支付:10.00
成就一亿技术人!
领取后你会自动成为博主和红包主的粉丝 规则
hope_wisdom
发出的红包

打赏作者

为了维护世界和平_

你的鼓励将是我创作的最大动力

¥1 ¥2 ¥4 ¥6 ¥10 ¥20
扫码支付:¥1
获取中
扫码支付

您的余额不足,请更换扫码支付或充值

打赏作者

实付
使用余额支付
点击重新获取
扫码支付
钱包余额 0

抵扣说明:

1.余额是钱包充值的虚拟货币,按照1:1的比例进行支付金额的抵扣。
2.余额无法直接购买下载,可以购买VIP、付费专栏及课程。

余额充值