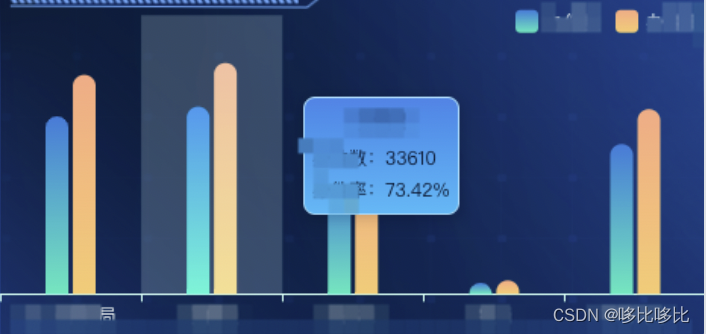
最终效果
柱状图的展示需要的值是数字,字符串的没办法展示,需要两个循环来把字符串转化成数字。
const data=[......]
const arr = {
legend: [],
data1: [],
data2: [],
data3: [],
};
let maxNum = 0;
data.forEach((item) => {
arr.legend.push(item.Name);
arr.data1.push(item.Num);
arr.data2.push(item.Rate);
if (maxNum < item.HandNum) maxNum = item.HandNum;
});
data.forEach((item) => {
let num = item.Rate.replace("", "%");
num = parseFloat(item.Rate);
let val = num * maxNum * 0.01;
arr.data3.push(val);
});
let option = {
tooltip: false,
legend: {
top: "-2%",
right: "0",
itemWidth: 15,
itemHeight: 15,
textStyle: {
color: "#fff",
},
},
grid: {
top: "2%",
left: "0.2%",
right: "0.3%",
bottom: "12%",
},
yAxis: {
type: "value",
splitLine: {
show: false,
},
axisLabel: { color: "rgba(255, 255, 255, 0)" },
},
xAxis: [
{
position: "left",
type: "category",
boundaryGap: [0, 0.01],
splitLine: {
show: false,
},
axisLine: {
lineStyle: {
type: "solid",
color: "rgba(208, 255, 246, 1)",
},
},
data: arr.legend,
axisLabel: { color: "rgba(255, 255, 255, 1)", fontSize: 12 },
},
],
series: [
{
name: "name1",
type: "bar",
barWidth: 15,
itemStyle: {
normal: {
color: new echarts.graphic.LinearGradient(0, 0, 0, 1, [
{
offset: 1,
color: "rgba(1, 233, 189, 1)",
},
{
offset: 0,
color: "rgba(0, 124, 222, 1)",
},
]),
borderRadius: [15, 15, 0, 0],
},
},
data: arr.data1,
},
{
name: "name2",
type: "bar",
barWidth: 15,
itemStyle: {
normal: {
color: new echarts.graphic.LinearGradient(0, 0, 0, 1, [
{
offset: 1,
color: "rgba(247, 203, 107, 1)",
},
{
offset: 0,
color: "rgba(251, 169, 128, 1)",
},
]),
borderRadius: [15, 15, 0, 0],
},
},
data: arr.data2,
},
],
tooltip: {
trigger: "axis",
axisPointer: {
type: "shadow",
},
padding: 0,
borderWidth: 0,
backgroundColor: "transparent",
formatter: function (params) {
let index = params[0].dataIndex;
const css = `padding:5px;
border: 1px solid #A6DCFF;
background: linear-gradient(0deg, #0BBAFB 0%, #4285EC 100%);
border-radius: 8px;min-width:80px;font-size: 12px;color: #02132F;`;
const text = `
<div style="${css}">
<p style="margin-bottom:3px;text-align: center; font-size: 14px;">${
params[0].axisValue
}</p>
<span style="font-size:12px">办件数:${params[0].value || 0}</span><br/>
<span style="font-size:12px">办件率:${
arr.data3[index] || 0
}</span><br/></div>
`;
return text;
},
},
};
const myChartCategory = echarts.init(this.$refs.zztChart);
myChartCategory.setOption(option);


 3112
3112


 被折叠的 条评论
为什么被折叠?
被折叠的 条评论
为什么被折叠?
 到【灌水乐园】发言


