图示
代码
def plot_one_dim(x, id2Name=None, xLabel=None, yLabel=None):
    """
    功能: 绘制一维散点图
    输入:
        x:np,(N)          # 散点横坐标
        id2Name:dict,     # 散点标签
        xLabel:string,(1) # x轴标签
        yLabel:string,(1) # y轴标签
    """
    C = max(x) - min(x)
    fig = plt.figure(figsize=(10, 1))

    # 给Y坐标赋值为0
    N = len(x)
    y = np.zeros(N)


    # 绘制散点
    ax = fig.add_subplot(111, frameon=True, yticks=[])

    ax.spines['top'].set_visible(False)
    ax.spines['right'].set_visible(False)
    ax.spines['left'].set_visible(False)
    ax.scatter(x,y,c='g')
    ax.yaxis.set_ticks_position('left')

    # 生成散点标签, 绘制标签
    if id2Name is not None:
        titles = [id2Name[i] for i in range(N)]
        for i in range(N):
            ax.annotate(titles[i], (x[i], y[i]))

    # 将y坐标的0显示为yLabel
    if yLabel is not None:
        plt.yticks([0],[yLabel])

    # 显示xLabel
    if xLabel is not None:
        ax.set(xlabel=xLabel)

    # 设置y坐标轴范围
    plt.ylim((0, 2))


    plt.show()
使用
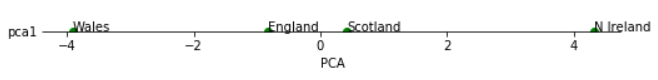
x = np.array([-0.8266125,  4.319269 ,  0.4226014, -3.9152584])
id2Name = {0: 'England', 1: 'N Ireland', 2: 'Scotland', 3: 'Wales'}

import numpy as np
import matplotlib.pyplot as plt
plot_one_dim(np.array(Y.view(-1)), id2Name, "PCA", "pca1")


 2067
2067


 被折叠的 条评论
为什么被折叠?
被折叠的 条评论
为什么被折叠?
 到【灌水乐园】发言


