


树状图是一种常见的层次结构可视化方式,它能够清晰地展示数据之间的父子关系。本文将详细介绍如何使用D3.js创建树状图,并解析相关核心API的使用方法。
一、核心API解析
1. d3.hierarchy
d3.hierarchy 是构建树状图的基础,它从给定的层次结构数据构造一个根节点,并为各个节点指定深度等属性:
var hierarchyData = d3.hierarchy(data)
    .sum(function (d,i) {
        return d.value;
    });
调用后,每个节点会被附加以下属性:
node.data- 关联的原始数据node.depth- 当前节点的深度,根节点为0node.height- 当前节点的高度,叶节点为0node.parent- 当前节点的父节点node.children- 当前节点的子节点node.value- 当前节点及后代节点的总计值
2. d3.tree
d3.tree 创建一个新的整齐(同深度节点对齐)的树布局生成器:
var tree = d3.tree()
    .size([width, height])
    .separation(function(a,b) {
        return (a.parent==b.parent?1:2)/a.depth;
    });
关键配置方法:
tree.size([width, height])- 设置布局尺寸tree.separation()- 设置相邻节点间距函数
3. 节点操作方法
node.descendants()- 返回从当前节点开始的所有后代节点数组node.links()- 返回当前节点所在子树的所有边(连接线)
二、完整实现解析
👇 代码示例
<!DOCTYPE html>
<html lang="en">
<head>
    <meta charset="UTF-8">
    <title>D3.js 树状图实现</title>
    <script src="https://d3js.org/d3.v7.min.js"></script>
    <style>
        .node circle {
            fill: #4a8bc9;
            stroke: #2c6cb0;
            stroke-width: 2px;
        }
        .node text {
            font: 12px sans-serif;
            fill: #333;
        }
        .link {
            fill: none;
            stroke: #ccc;
            stroke-width: 1.5px;
        }
        .node:hover circle {
            fill: #ff7f0e;
        }
        .node:hover text {
            font-weight: bold;
        }
    </style>
</head>
<body>
    <svg width="1000" height="600"></svg>

    <script>
        // 层次结构数据
        const data = {
            name: "中国",
            children: [
                {
                    name: "浙江",
                    children: [
                        {name: "杭州", value: 100},
                        {name: "宁波", value: 100},
                        {name: "温州", value: 100},
                        {name: "绍兴", value: 100}
                    ]
                },
                {
                    name: "广西",
                    children: [
                        {
                            name: "桂林",
                            children: [
                                {name: "秀峰区", value: 100},
                                {name: "叠彩区", value: 100},
                                {name: "象山区", value: 100},
                                {name: "七星区", value: 100}
                            ]
                        },
                        {name: "南宁", value: 100},
                        {name: "柳州", value: 100},
                        {name: "防城港", value: 100}
                    ]
                },
                {
                    name: "黑龙江",
                    children: [
                        {name: "哈尔滨", value: 100},
                        {name: "齐齐哈尔", value: 100},
                        {name: "牡丹江", value: 100},
                        {name: "大庆", value: 100}
                    ]
                },
                {
                    name: "新疆",
                    children: [
                        {name: "乌鲁木齐", value: 100},
                        {name: "克拉玛依", value: 100},
                        {name: "吐鲁番", value: 100},
                        {name: "哈密", value: 100}
                    ]
                }
            ]
        };

        // 设置SVG和边距
        const margin = {top: 60, right: 120, bottom: 60, left: 60};
        const width = 1000 - margin.left - margin.right;
        const height = 600 - margin.top - margin.bottom;

        // 创建SVG容器
        const svg = d3.select("svg")
            .attr("width", width + margin.left + margin.right)
            .attr("height", height + margin.top + margin.bottom)
            .append("g")
            .attr("transform", `translate(${margin.left},${margin.top})`);

        // 创建层级布局
        const root = d3.hierarchy(data);
        root.sum(d => d.value || 0); // 计算每个节点的值

        // 创建树布局
        const treeLayout = d3.tree()
            .size([height, width - 200]) // 交换宽高以创建水平树
            .separation((a, b) => (a.parent === b.parent ? 1 : 1.5) / a.depth);

        // 应用布局到数据
        treeLayout(root);

        // 创建连接线生成器
        const linkGenerator = d3.linkHorizontal()
            .x(d => d.y)
            .y(d => d.x);

        // 绘制连接线
        svg.append("g")
            .selectAll(".link")
            .data(root.links())
            .join("path")
            .attr("class", "link")
            .attr("d", linkGenerator);

        // 创建节点组
        const node = svg.append("g")
            .selectAll(".node")
            .data(root.descendants())
            .join("g")
            .attr("class", "node")
            .attr("transform", d => `translate(${d.y},${d.x})`);

        // 添加圆形节点
        node.append("circle")
            .attr("r", 8)
            .on("mouseover", function() {
                d3.select(this).attr("r", 10);
            })
            .on("mouseout", function() {
                d3.select(this).attr("r", 8);
            });

        // 添加文本标签
        node.append("text")
            .attr("dy", "0.31em")
            .attr("x", d => d.children ? -15 : 15)
            .attr("text-anchor", d => d.children ? "end" : "start")
            .text(d => d.data.name)
            .clone(true).lower()
            .attr("stroke", "white")
            .attr("stroke-width", 3); // 添加白色描边使文字更清晰

        // 添加简单的缩放功能
        svg.call(d3.zoom()
            .scaleExtent([0.5, 2])
            .on("zoom", (event) => {
                svg.attr("transform", event.transform);
            }));
    </script>
</body>
</html>
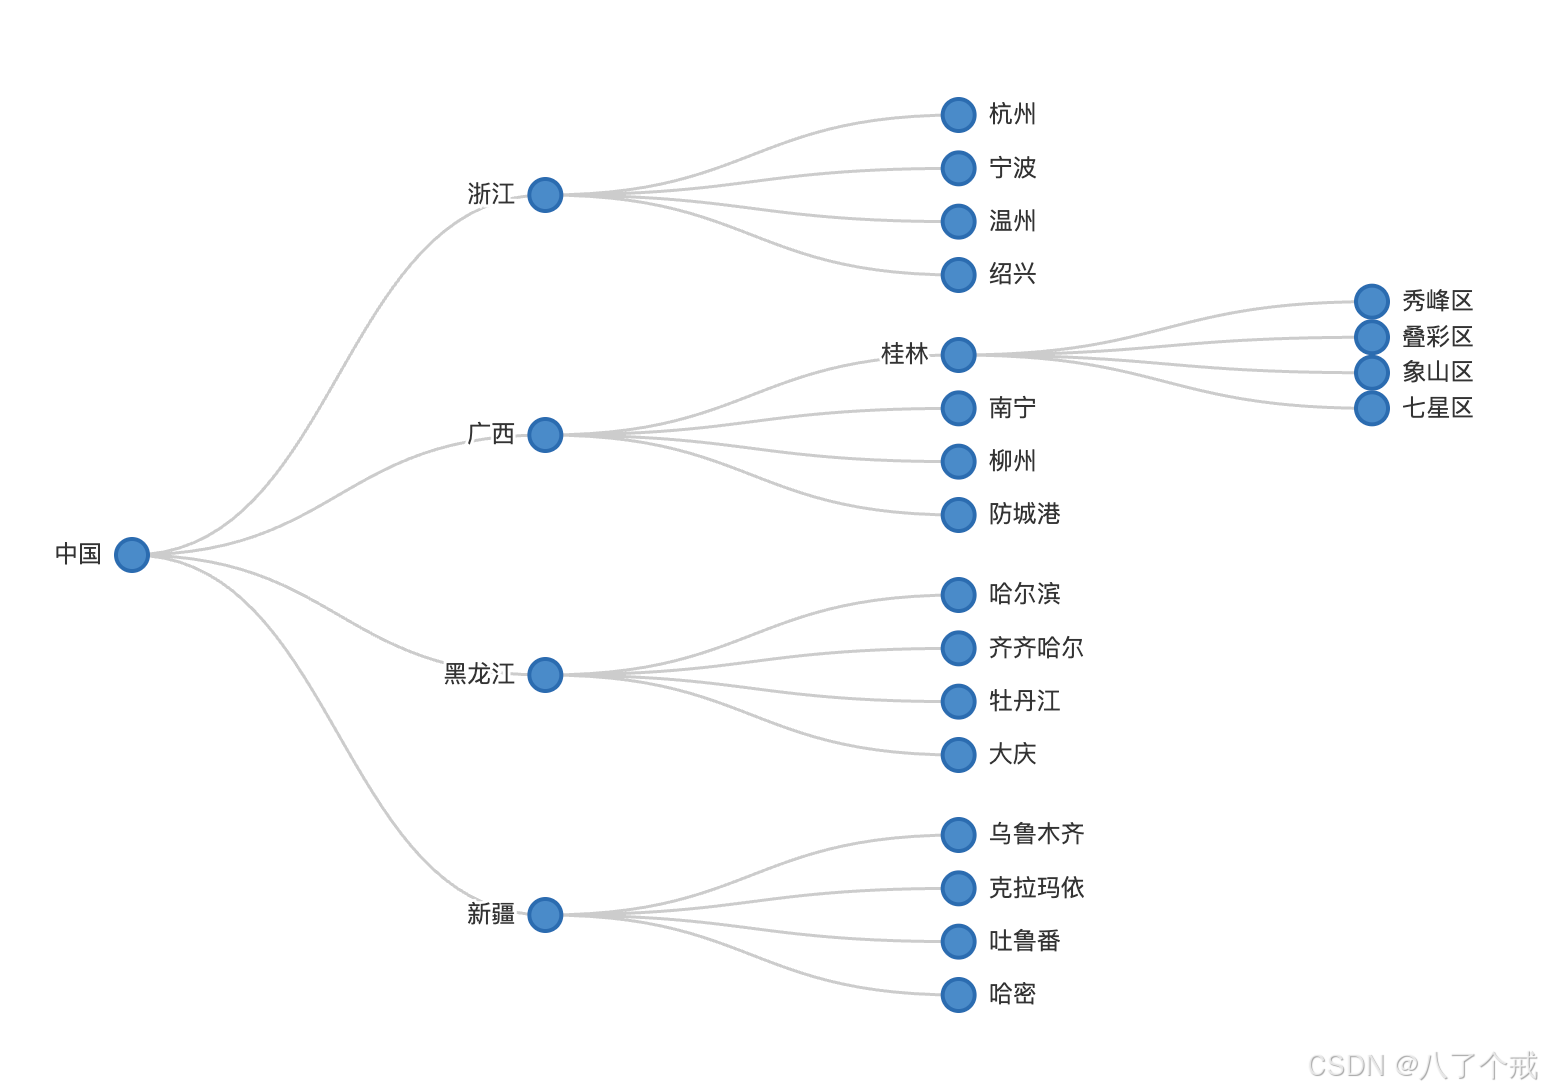
👇 实现效果
三、高级技巧与优化
1. 交互功能: 可以添加鼠标悬停效果,如高亮节点、显示详细信息等
2. 动画过渡: 使用D3的过渡效果让树状图的展开/收起更加平滑
3. 径向布局: 修改链接生成器可以创建放射状的树状图
4. 缩放和平移: 对于大型树状图,可以添加缩放和平移功能
四、常见问题解决
1. 节点重叠: 调整separation函数或使用不同的布局算法
2. 文本溢出: 根据文本长度动态调整位置或添加省略号
3. 性能优化: 对于大型数据集,考虑使用虚拟DOM或简化渲染
小结
1. 核心概念理解
- 树状图是展示层次结构数据的有效方式
- D3的树布局算法会自动计算节点的位置
- 数据需要通过
d3.hierarchy()转换为适合可视化的格式
2. 关键步骤
-
数据准备: 构建层次结构数据
-
创建层级: 使用
d3.hierarchy() -
布局计算: 使用
d3.tree()定义布局 -
绘制元素: 分别绘制连接线和节点
-
添加交互: 如缩放、悬停效果
3. 优化技巧
-
使用CSS样式分离视觉表现
-
添加交互效果增强用户体验
-
文本描边提高可读性
-
实现缩放功能处理大型树
4. 扩展方向
-
添加节点展开/折叠功能
-
实现动态数据更新
-
创建径向树状图
-
添加工具提示显示详细信息
5. 实际应用场景
- 组织结构图
- 文件目录结构
- 家谱图
- 决策树可视化
- 产品分类


 2689
2689

 被折叠的 条评论
为什么被折叠?
被折叠的 条评论
为什么被折叠?
 到【灌水乐园】发言


