


饼图绘制详解与实现
一、饼图绘制核心知识
1. d3.arc() 弧形生成器
-
功能: 生成圆形、扇形或环形路径
-
核心参数:
innerRadius:内半径(0时为实心饼图)outerRadius:外半径cornerRadius:圆角半径(创建圆角扇形)padAngle:扇形间隔角度
const arc = d3.arc()
  .innerRadius(50)
  .outerRadius(100)
  .cornerRadius(5); // 添加圆角效果
2. d3.pie() 布局函数
- 功能: 将原始数据转换为角度数据
- 特点:
- 自动计算每个数据项的起始/结束角度
- 支持排序功能(
pie.sort()) - 可设置起始角度(
pie.startAngle())
const pie = d3.pie()
  .sort(null) // 禁用排序
  .value(d => d); // 指定数据访问器
3. arc.centroid() 中心点计算
- 数学原理:
[(startAngle + endAngle)/2, (innerRadius + outerRadius)/2] - 应用场景:
- 标签定位
- 交互元素定位
- 动画中心点
4. 颜色方案
d3.schemeCategory10:10种分类颜色- 其他方案:
d3.schemeAccent:8种强调色d3.schemeSet3:12种柔和色
二、饼图实现代码
👇 完整代码
<!DOCTYPE html>
<html lang="en">
<head>
<meta charset="UTF-8">
<title>交互式饼图</title>
<script src="https://d3js.org/d3.v7.min.js"></script>
<style>
.tooltip {
position: absolute;
padding: 8px;
background: rgba(0,0,0,0.8);
color: white;
border-radius: 4px;
pointer-events: none;
font-size: 12px;
}
.chart-title {
text-anchor: middle;
font-size: 16px;
font-weight: bold;
}
</style>
</head>
<body>
<svg width="500" height="450"></svg>
<div class="tooltip"></div>
<script>
// 配置参数
const config = {
margin: {top: 50, right: 30, bottom: 30, left: 30},
innerRadius: 60,
outerRadius: 120,
cornerRadius: 5,
padAngle: 0.02
};
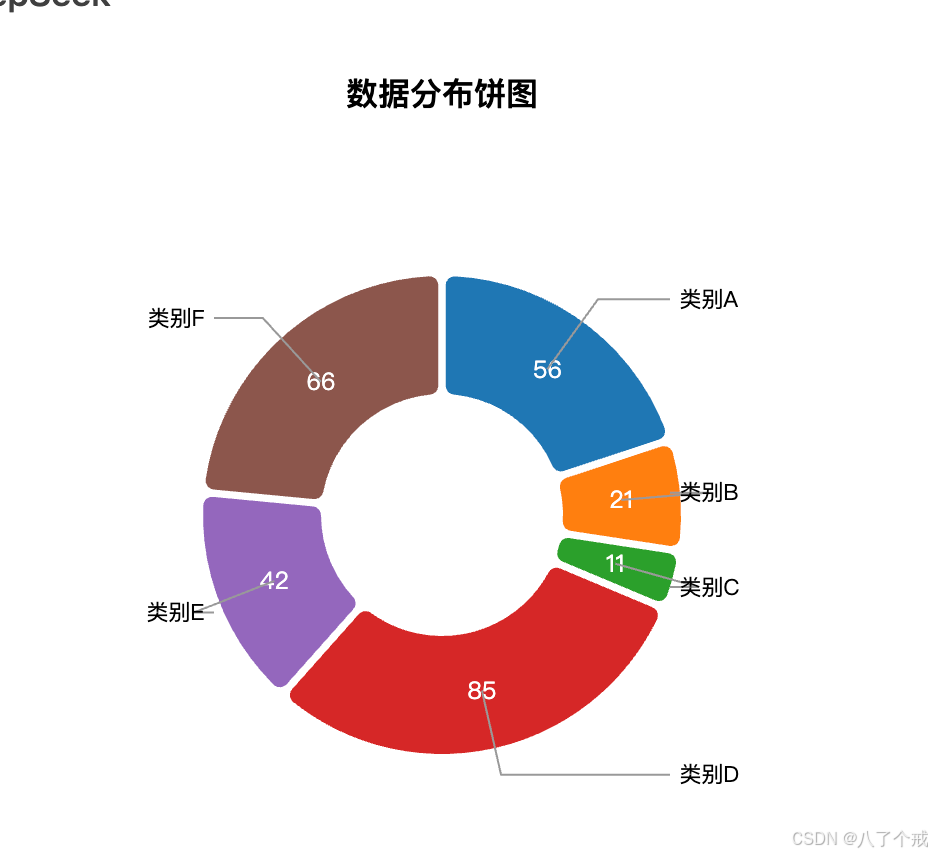
// 准备数据
const data = [
{name: "类别A", value: 56},
{name: "类别B", value: 21},
{name: "类别C", value: 11},
{name: "类别D", value: 85},
{name: "类别E", value: 42},
{name: "类别F", value: 66}
];
// 初始化SVG
const svg = d3.select('svg');
const width = +svg.attr('width');
const height = +svg.attr('height');
const chartWidth = width - config.margin.left - config.margin.right;
const chartHeight = height - config.margin.top - config.margin.bottom;
const tooltip = d3.select('.tooltip');
// 创建图表容器
const g = svg.append('g')
.attr('transform', `translate(${config.margin.left + chartWidth/2}, ${config.margin.top + chartHeight/2})`);
// 添加标题
svg.append('text')
.attr('class', 'chart-title')
.attr('x', width/2)
.attr('y', 30)
.text('数据分布饼图');
// 颜色比例尺
const colorScale = d3.scaleOrdinal()
.domain(data.map(d => d.name))
.range(d3.schemeCategory10);
// 饼图布局
const pie = d3.pie()
.sort(null)
.value(d => d.value);
// 弧形生成器
const arc = d3.arc()
.innerRadius(config.innerRadius)
.outerRadius(config.outerRadius)
.cornerRadius(config.cornerRadius)
.padAngle(config.padAngle);
// 外环弧形(用于鼠标事件)
const outerArc = d3.arc()
.innerRadius(config.outerRadius * 1.02)
.outerRadius(config.outerRadius * 1.2);
// 生成饼图数据
const arcs = pie(data);
// 绘制扇形
const slices = g.selectAll('.slice')
.data(arcs)
.enter()
.append('g')
.attr('class', 'slice');
slices.append('path')
.attr('d', arc)
.attr('fill', (d,i) => colorScale(d.data.name))
.attr('stroke', '#fff')
.attr('stroke-width', 1)
.on('mouseover', function(d) {
d3.select(this)
.transition()
.duration(200)
.attr('opacity', 0.8)
.attr('stroke-width', 2);
tooltip.transition()
.duration(200)
.style('opacity', 1);
tooltip.html(`${d.data.name}: ${d.data.value} (${((d.endAngle - d.startAngle)/(2*Math.PI)*100).toFixed(1)}%)`)
.style('left', (d3.event.pageX + 10) + 'px')
.style('top', (d3.event.pageY - 28) + 'px');
})
.on('mouseout', function() {
d3.select(this)
.transition()
.duration(200)
.attr('opacity', 1)
.attr('stroke-width', 1);
tooltip.transition()
.duration(200)
.style('opacity', 0);
})
.on('click', function(d) {
alert(`点击了${d.data.name}分类,值为${d.data.value}`);
});
// 添加标签
slices.append('text')
.attr('transform', d => `translate(${arc.centroid(d)})`)
.attr('dy', '0.35em')
.attr('text-anchor', 'middle')
.text(d => d.data.value)
.style('fill', '#fff')
.style('font-size', '12px')
.style('pointer-events', 'none');
// 添加引导线
const polyline = slices.append('polyline')
.attr('points', function(d) {
const pos = outerArc.centroid(d);
pos[0] = config.outerRadius * 0.95 * (midAngle(d) < Math.PI ? 1 : -1);
return [arc.centroid(d), outerArc.centroid(d), pos];
})
.attr('stroke', '#999')
.attr('stroke-width', 1)
.attr('fill', 'none');
// 添加分类名称
slices.append('text')
.attr('transform', function(d) {
const pos = outerArc.centroid(d);
pos[0] = config.outerRadius * 0.99 * (midAngle(d) < Math.PI ? 1 : -1);
return `translate(${pos})`;
})
.attr('dy', '0.35em')
.attr('text-anchor', function(d) {
return midAngle(d) < Math.PI ? 'start' : 'end';
})
.text(d => d.data.name)
.style('font-size', '11px');
// 辅助函数:计算中间角度
function midAngle(d) {
return d.startAngle + (d.endAngle - d.startAngle)/2;
}
</script>
</body>
</html>
👇 运行效果
小结
核心知识点
1. 数据转换流程:
- 原始数据 → d3.pie() → 角度数据 → d3.arc() → SVG路径
2. 视觉元素构成:
- 基础扇形(arc生成)
- 中心标签(centroid定位)
- 引导线与分类标签
3. 交互实现:
- 鼠标悬停高亮
- 工具提示显示详细信息
- 点击事件响应


 1952
1952

 被折叠的 条评论
为什么被折叠?
被折叠的 条评论
为什么被折叠?
 到【灌水乐园】发言


