


Project Report | Capstone Project – The Battle of Neighborhoods
1. Intoduction
This project aims to find the better neighborhood environment, like pub, park or gym. With the map of Scarborough, Toranto, this project will help people to decide which neighborhood is the beneficial place compared to various participants neighborhood.
As lots of people are migrating to Toranto. They need information and resources to balance housing price and schools for their children. So, this project is for those people among choosing neighborhoods, like the access to cafes, schools, super markets, hospitals, etc.
This project will analyse features for people migrating to Scarborough to search a best neighborhood. The features include median housing price and better school, lower crime rates, road connectivity, good management for emergency facilities, and recreational facilities.
People will get an awareness of that area before moving to a new city.
Foursquare API Data:
Foursquare provides different data information in different venues among neighborhoods. Those information includes venue names, locations, menus and even photos. The foursquare platform is to obtain the required information through the API.
With the gaining information of neighborhoods, Foursquare API would gather information about venues of neighborhoods. For each neighborhood, the radius is 100 meters.
Foursquare data contains venues, longitude, latitude and postcodes. The information obtained per venue as follows:
- Neighborhood
- Neighborhood Latitude
- Neighborhood Longitude
- Venue
- Name of the venue e.g. the name of a store or restaurant
- Venue Latitude
- Venue Longitude
- Venue Category
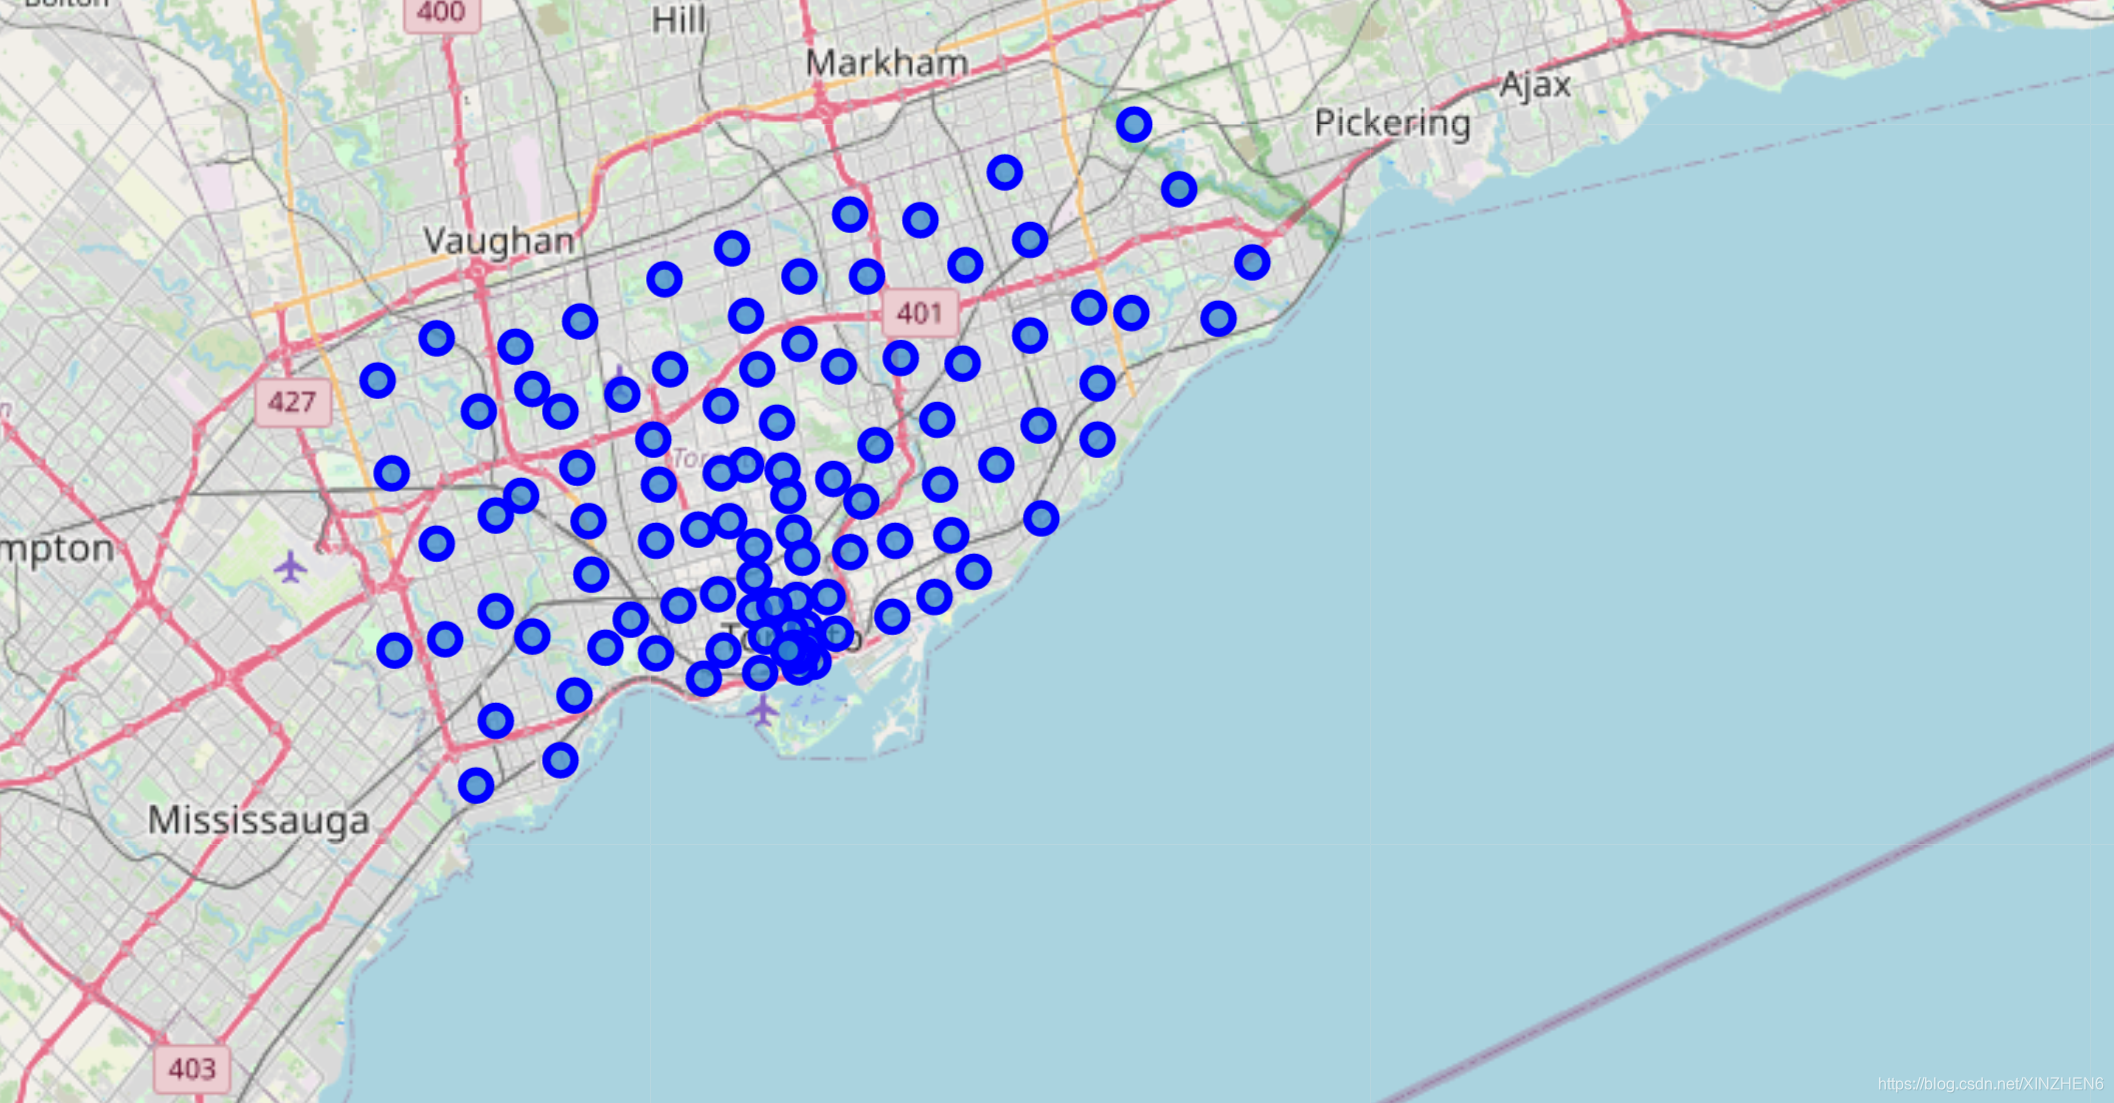
Map of Scarborough

2. Data
Data Link: https://en.wikipedia.org/wiki/List_of_postal_codes_of_Canada:_M
In this project, I’d like to use Scarborough dataset which we scrapped from wikipedia on Week 3. Dataset consisting of latitude and longitude, zip codes.
3. Methodology Section
过程:
在维基上以lxml的形式获得街区数据,邮编,名称,地区,然后整理数据tr分行td分列,通过geocoder用邮编获取对应位置的经纬度,整理数据,通过folium画出各区地图
链接Foursquare,获取对应地区的详细信息,包括

数据清洗删除无效的行列,整理,统计数据,例如什么的多少,用one hot code表示各个类别,数据归一化,按照频率划分,比如某个社区的coffee占总数的比例,Kmeans分类,通过不同类别做出图形,结合school rate 和房价做评分。
Clustering Approach:
To compare the similarities of two cities, we decided to explore neighborhoods, segment them, and group them into clusters to find similar neighborhoods in a big city like New York and Toronto. To be able to do that, we need to cluster data which is a form of unsupervised machine learning: k-means clustering algorithm.
K-Means Clustering Algoritm

Most Common venues in each Neighborhood

Work Flow:
With my credentials of Foursquare API, features of the neighborhoods would be gathered and utilized. As the request limitations, the radius parameter of neighborhood is set to 700 and the total number of place requests is set to 100.
4. Results
** Map of Foursquare Request**
Map of Clusters in Scarborough

Average Housing Price by Clusters in Scarborough

Schools Rating by Clusters in Scarborough

5. Discussion
Problem Solved:
The purpose of this project offer suggestions to people with a better neighborhood in Scarborough.So the connectivity to the airport, bus stops, distance to the downtown, markets and etc are conuts.
Sorted list of house in terms of housing prices in a ascending or descending order
Sorted list of schools in terms of location, fees, rating and reviews
6. Conclusion
With the help of k-means cluster algorithm, the neighborhoods are separated into 10 clusters with 103 different lattitude and logitude from the dataset. The dataset has similar neighborhoods around. The charts represents a particular neighborhood with average house prices and school ratings .
I really appreciate this opportunity and experience with the efforts to deal with all the tasks. This project is a practical application in a real situation by using Data Science tools.The mapping with Folium is a useful tool to consolidate information and make analysis visualized.
Improvment:
With farther works, this project could be more precise in terms in find the best house not only based on price in Scarborough. It may requires something else around.
Depended Libraries :
Pandas: To create and edit dataframes.
Folium: To visualize the neighborhood clusters distribution.
Scikit Learn: To import clustering algorithms.
JSON: To handle JSON files.
XML: To separate data from presentation and XML stores data in plain text format.
Geocoder: To retrieve location from data.
Beautiful Soup and Requests: To extract data from HTML and XML.
Matplotlib: To draw plots.


 605
605

 被折叠的 条评论
为什么被折叠?
被折叠的 条评论
为什么被折叠?
 到【灌水乐园】发言


