python性能检测工具函数运行内存及运行时间

前言:

python虽然是一门'慢语言',但是也有着比较多的性能检测工具来帮助我们优化程序的运行效率。这里总结了五个比较好的python性能检测工具,包括内存使用、运行时间、执行次数等方面。

首先,来编写一个基础的python函数用于在后面的各种性能测试。

1

2

3

def base_func():

    for n in range(10000):

        print('当前n的值是:{}'.format(n))

1、memory_profiler进程监视

memory_profiler是python的非标准库,所以这里采用pip的方式进行安装。
它能够监视进程、了解内存使用等情况。

1

pip install memory_profiler

安装好memory_profiler库以后,直接使用注解的方式进行测试

1

2

3

4

5

6

7

8

9

10

11

12

from memory_profiler import profile

@profile

def base_func1():

    for n in range(10000):

        print('当前n的值是:{}'.format(n))

base_func1()

# Line #    Mem usage    Increment  Occurrences   Line Contents

# =============================================================

#     28     45.3 MiB     45.3 MiB           1   @profile

#     29                                         def base_func():

#     30     45.3 MiB      0.0 MiB       10001       for n in range(10000):

#     31     45.3 MiB      0.0 MiB       10000           print('当前n的值是:{}'.format(n))

从返回的数据结果来看,执行当前函数使用了45.3 MiB的内存。

2、timeit 时间使用情况

timeit是python的内置模块,可以测试单元格的代码运行时间,由于是内置模块所以并不需要单独安装。

1

2

3

4

5

6

import timeit

def base_func2():

    for n in range(10000):

        print('当前n的值是:{}'.format(n))

res = timeit.timeit(base_func2,number=5)

print('当前的函数的运行时间是:{}'.format(res))

当前的函数的运行时间是:0.9675800999999993

根据上面函数的运行返回结果,函数的运行时间是0.96秒。

3、line_profiler行代码运行时间检测

如果在只需要检测函数的局部运行时间的话就可以使用line_profiler了,它可以检测出每行代码的运行时间。
line_profiler是python的非标准库,使用的使用pip的方式安装一下。

1

pip install line_profiler

最简便的使用方式直接将需要测试的函数加入即可。

1

2

3

4

5

6

7

8

9

10

11

12

13

14

15

def base_func3():

    for n in range(10000):

        print('当前n的值是:{}'.format(n))

from line_profiler import LineProfiler

lp = LineProfiler()

lp_wrap = lp(base_func3)

lp_wrap()

lp.print_stats()

# Line #      Hits         Time  Per Hit   % Time  Line Contents

# ==============================================================

#     72                                           def base_func3():

#     73     10001     162738.0     16.3      4.8      for n in range(10000):

#     74     10000    3207772.0    320.8     95.2          print('当前n的值是:{}'.format(n))

从运行结果可以看出每行代码的运行时间及比例,注意这里的时间单位是微妙。
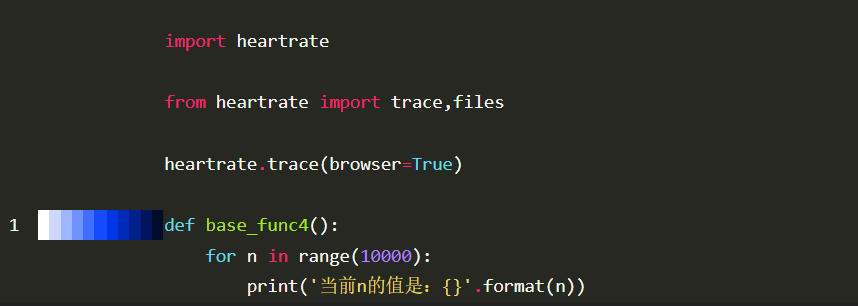
4、heartrate可视化检测工具

heartrate最值得推荐的是可以在网页上面向检测心率一样检测程序的执行过程,同时,
他还是非标准库,使用pip的方式进行安装。

1

2

3

4

5

6

# pip install heartrate

import heartrate

heartrate.trace(browser=True)

def base_func4():

    for n in range(10000):

        print('当前n的值是:{}'.format(n))

运行以后,控制台打印如下日志:

#  * Serving Flask app "heartrate.core" (lazy loading)
#  * Environment: production
#    WARNING: This is a development server. Do not use it in a production deployment.
#    Use a production WSGI server instead.
#  * Debug mode: off

并且自动打开浏览器地址:http://127.0.0.1:9999

file

​现在我也找了很多测试的朋友,做了一个分享技术的交流群,共享了很多我们收集的技术文档和视频教程。
如果你不想再体验自学时找不到资源,没人解答问题,坚持几天便放弃的感受
qq群号:485187702【暗号:csdn11】
可以加入我们一起交流。而且还有很多在自动化,性能,安全,测试开发等等方面有一定建树的技术大牛
分享他们的经验,还会分享很多直播讲座和技术沙龙
可以免费学习!划重点!开源的!!!

最后感谢每一个认真阅读我文章的人,看着粉丝一路的上涨和关注,礼尚往来总是要有的,虽然不是什么很值钱的东西,如果你用得到的话可以直接拿走! 希望能帮助到你!【100%无套路免费领取】

  • 2
    点赞
  • 6
    收藏
    觉得还不错? 一键收藏
  • 0
    评论
评论
添加红包

请填写红包祝福语或标题

红包个数最小为10个

红包金额最低5元

当前余额3.43前往充值 >
需支付:10.00
成就一亿技术人!
领取后你会自动成为博主和红包主的粉丝 规则
hope_wisdom
发出的红包
实付
使用余额支付
点击重新获取
扫码支付
钱包余额 0

抵扣说明:

1.余额是钱包充值的虚拟货币,按照1:1的比例进行支付金额的抵扣。
2.余额无法直接购买下载,可以购买VIP、付费专栏及课程。

余额充值