


2020-1-31
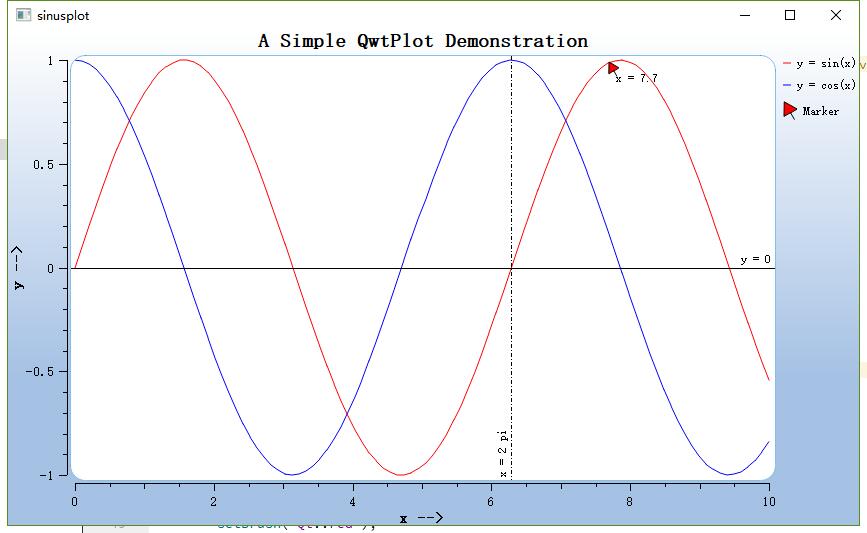
本次案例效果图如下所示,这次的效果不仅仅是下面看到的那么简单。这张图的内容是可以拖拽、缩放的。
本次案例还是一个sinusplot.cpp文件,它的类图如下所示
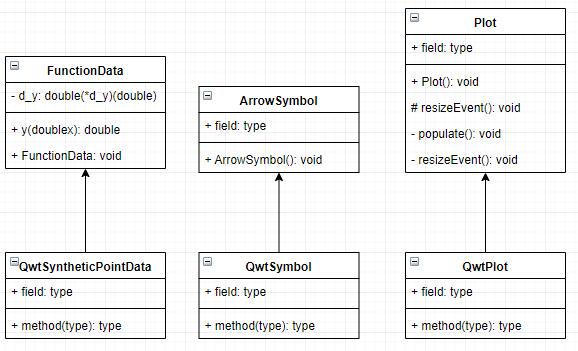
一共有三个类:FunctionData、ArrowSymbol、Plot,他们的父类如上图所示。其中FunctionData和ArrowSymbol是供Plot调用的。下面我们来逐个观察这些类的实现,以及他们之间的关系,先从FunctionData开始
包含必要的头文件
#include <qapplication.h>
#include <qlayout.h>
#include <qwt_plot.h>
#include <qwt_plot_marker.h>
#include <qwt_plot_curve.h>
#include <qwt_legend.h>
#include <qwt_point_data.h>
#include <qwt_plot_canvas.h>
#include <qwt_plot_panner.h>
#include <qwt_plot_magnifier.h>
#include <qwt_text.h>
#include <qwt_symbol.h>
#include <qwt_math.h>
#include <math.h>
FunctionData类实现
class FunctionData: public QwtSyntheticPointData
{
public:
    FunctionData( double( *fy )( double ) ):
        QwtSyntheticPointData( 100 ),
        d_y( fy )
    {
    }

    virtual double y( double x ) const
    {
        return d_y( x );
    }

private:
    double( *d_y )( double );
};
//这里涉及到一个QwtSyntheticPointData类,这个类的官方文档解释如下:
//QwtSyntheticPointData在一个间隔提供固定数量的点,这些点在x轴上等距分布,通常情况下,这个距离就是画布的x轴。
//在这种模式下,你可以通过缩放来得到不同等级的细节

//下面是我自己的理解:
//我们可以利用QwtSyntheticPointData来生成一系列数据点,这些数据点的数量以及生成方式是由我们在创建对象的时候通过构造函数提供的,y(double x)是一个虚函数,它会被自动调用来生成数据点
看了上面的注释,大家可能还是一知半解,不过没关系,反正现在也用不到,继续往下看
ArrowSymbol类实现
class ArrowSymbol: public QwtSymbol
{
public:
    ArrowSymbol()
    {
        QPen pen( Qt::black, 0 );
        //创建一个画笔
        pen.setJoinStyle( Qt::MiterJoin );
        //设置画笔样式

        setPen( pen );
        //设置画笔
        setBrush( Qt::red );
        //设置画刷

        QPainterPath path;
        //创建画笔路径
        path.moveTo( 0, 8 );
        path.lineTo( 0, 5 );
        path.lineTo( -3, 5 );
        path.lineTo( 0, 0 );
        path.lineTo( 3, 5 );
        path.lineTo( 0, 5 );
        //设置画笔路径

        QTransform transform;
        transform.rotate( -30.0 );
        path = transform.map( path );
        //进行坐标系转换

        setPath( path );
        setPinPoint( QPointF( 0, 0 ) );
        //设置符号形状

        setSize( 10, 14 );
        //设置符号尺寸
    }
};
ArrowSymbol继承自QwtSymbol,在构造函数中重新构建了Symbol的样式。生成了属于自己的Symbol。
Plot类实现
class Plot : public QwtPlot
{
public:
    Plot( QWidget *parent = NULL );

protected:
    virtual void resizeEvent( QResizeEvent * );

private:
    void populate();
    void updateGradient();
};
这个类由继承自QwtPlot。也就是说,它拥有了一个画板所拥有的所有属性,我们需要的是在这个画板上面添加我们自己的东西。下面我们逐个观察它的成员函数
构造函数Plot实现
Plot::Plot( QWidget *parent ) : QwtPlot( parent )
{
    setAutoFillBackground( true );
    //设置自动为画板填充背景,背景的颜色由来自widget's palette的QPalette::Window决定
    setPalette( QPalette( QColor( 165, 193, 228 ) ) );
    //设置调色板
    updateGradient();
    //后面再说


    setTitle( "A Simple QwtPlot Demonstration" );
    //设置画板标题

    insertLegend( new QwtLegend(), QwtPlot::RightLegend );
    //插入图例

    // axes
    setAxisTitle( xBottom, "x -->" );
    setAxisScale( xBottom, 0.0, 10.0 );
    //设置画板x底坐标轴标题与范围

    setAxisTitle( yLeft, "y -->" );
    setAxisScale( yLeft, -1.0, 1.0 );
    //设置画板y左坐标轴标题与范围

    // canvas
    QwtPlotCanvas *canvas = new QwtPlotCanvas();
    canvas->setLineWidth( 1 );
    canvas->setFrameStyle( QFrame::Box | QFrame::Plain );
    canvas->setBorderRadius( 15 );
    //设置画布属性

    QPalette canvasPalette( Qt::white );
    canvasPalette.setColor( QPalette::Foreground, QColor( 133, 190, 232 ) );
    canvas->setPalette( canvasPalette );
    //设置画布调色板

    setCanvas( canvas );
    //将画布放到画板上

    // panning with the left mouse button
    ( void ) new QwtPlotPanner( canvas );
    //让画布可以平移

    // zoom in/out with the wheel
    ( void ) new QwtPlotMagnifier( canvas );
    //让画布可以缩放

    populate();
    //生成曲线
}
populate实现
void Plot::populate()
{
    // Insert new curves
    QwtPlotCurve *cSin = new QwtPlotCurve( "y = sin(x)" );
    //创建一条曲线
    cSin->setRenderHint( QwtPlotItem::RenderAntialiased );
    //设置渲染属性
    cSin->setLegendAttribute( QwtPlotCurve::LegendShowLine, true );
    //设置图例属性
    cSin->setPen( Qt::red );
    //设置画笔
    cSin->attach( this );
    //将曲线添加到画板上

    QwtPlotCurve *cCos = new QwtPlotCurve( "y = cos(x)" );
    cCos->setRenderHint( QwtPlotItem::RenderAntialiased );
    cCos->setLegendAttribute( QwtPlotCurve::LegendShowLine, true );
    cCos->setPen( Qt::blue );
    cCos->attach( this );
    //同上

    // Create sin and cos data
    cSin->setData( new FunctionData( ::sin ) );
    cCos->setData( new FunctionData( ::cos ) );
    //为曲线创建数据,这是一种特殊的数据,哪里特殊呢?特殊在,无论怎么放大曲线,你在画布上始终能够看到固定数量的点所构成的曲线,这让我们可以更好地看到曲线的许多细节,这种特性在进行理论分析观察函数曲线时,可能有用,但在类似于示波器那种性质的工作需求时,可能就没什么用处了。

    // Insert markers

    //  ...a horizontal line at y = 0...
    QwtPlotMarker *mY = new QwtPlotMarker();
    mY->setLabel( QString::fromLatin1( "y = 0" ) );
    mY->setLabelAlignment( Qt::AlignRight | Qt::AlignTop );
    mY->setLineStyle( QwtPlotMarker::HLine );
    mY->setYValue( 0.0 );
    mY->attach( this );
    //插入Marker,这里涉及到一个新的类QwtPlotMarker,这个类在官方的解释是这样的:
    //标记可以是水平线,垂直线,符号,标签或它们的任意组合,可以围绕边界矩形内的中心点进行绘制。

    //简单地来说,就是用来绘制一个标记的

    //  ...a vertical line at x = 2 * pi
    QwtPlotMarker *mX = new QwtPlotMarker();
    mX->setLabel( QString::fromLatin1( "x = 2 pi" ) );
    mX->setLabelAlignment( Qt::AlignLeft | Qt::AlignBottom );
    mX->setLabelOrientation( Qt::Vertical );
    mX->setLineStyle( QwtPlotMarker::VLine );
    mX->setLinePen( Qt::black, 0, Qt::DashDotLine );
    mX->setXValue( 2.0 * M_PI );
    mX->attach( this );
    //又设置了一个Marker

    const double x = 7.7;

    // an arrow at a specific position
    QwtPlotMarker *mPos = new QwtPlotMarker( "Marker" );
    mPos->setRenderHint( QwtPlotItem::RenderAntialiased, true );
    mPos->setItemAttribute( QwtPlotItem::Legend, true );
    mPos->setSymbol( new ArrowSymbol() );
    mPos->setValue( QPointF( x, ::sin( x ) ) );
    mPos->setLabel( QString( "x = %1" ).arg( x ) );
    mPos->setLabelAlignment( Qt::AlignRight | Qt::AlignBottom );
    mPos->attach( this );
    //又创建了一个Marker
}
updateGradient实现
void Plot::updateGradient()
{
    QPalette pal = palette();

    const QColor buttonColor = pal.color( QPalette::Button );

    QLinearGradient gradient( rect().topLeft(), rect().bottomLeft() );
    gradient.setColorAt( 0.0, Qt::white );
    gradient.setColorAt( 0.7, buttonColor );
    gradient.setColorAt( 1.0, buttonColor );

    pal.setBrush( QPalette::Window, gradient );
    setPalette( pal );
}
用来设置调色板,这里的调色板,我们可以理解为画板主题,它规定了画板上的各个元素的样式。
resizeEvent实现
void Plot::resizeEvent( QResizeEvent *event )
{
    QwtPlot::resizeEvent( event );

    // Qt 4.7.1: QGradient::StretchToDeviceMode is buggy on X11
    updateGradient();
}
当画板大小发生改动的时候,这个函数会被自动调用
最后就是main函数
int main( int argc, char **argv )
{
    QApplication a( argc, argv );

    Plot *plot = new Plot();

    // We put a dummy widget around to have
    // so that Qt paints a widget background
    // when resizing

    QWidget window;
    //创建一个QWidget窗口
    QHBoxLayout *layout = new QHBoxLayout( &window );
    //创建一个垂直布局
    layout->setContentsMargins( 0, 0, 0, 0 );
    //设置布局的边距
    layout->addWidget( plot );
    //将plot添加到布局中

    window.resize( 600, 400 );
    //重新设置Widget大小
    window.show();
    //显示窗口大小

    return a.exec();
}
要点总结:
- 理解QwtSyntheticPointData的概念,并掌握基本的使用方法
- 理解QwtSymbol,并且会定制、使用Symbol
- 理解画板、画布、调色板之间的关系,熟练掌握它们各自属性的设置。
- 知道resizeEvent函数的作用机制
- 理解QwtPlotPanner,QwtPlotMagnifier的作用并且学会使用


 491
491


 被折叠的 条评论
为什么被折叠?
被折叠的 条评论
为什么被折叠?
 到【灌水乐园】发言


