


在软件开发中,架构图是一种重要的工具,它帮助我们可视化系统的结构和组件之间的关系。今天,我们将探讨如何使用SVG(可缩放矢量图形)来绘制一个简单的架构图。SVG是一种基于XML的标记语言,用于描述二维矢量图形,非常适合用于创建清晰、可缩放的图形和图表。
思路
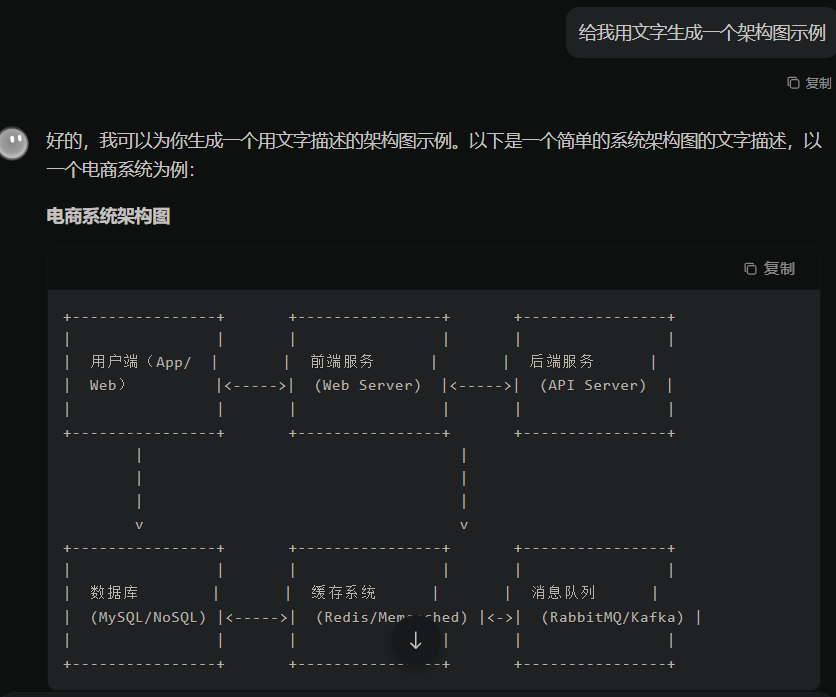
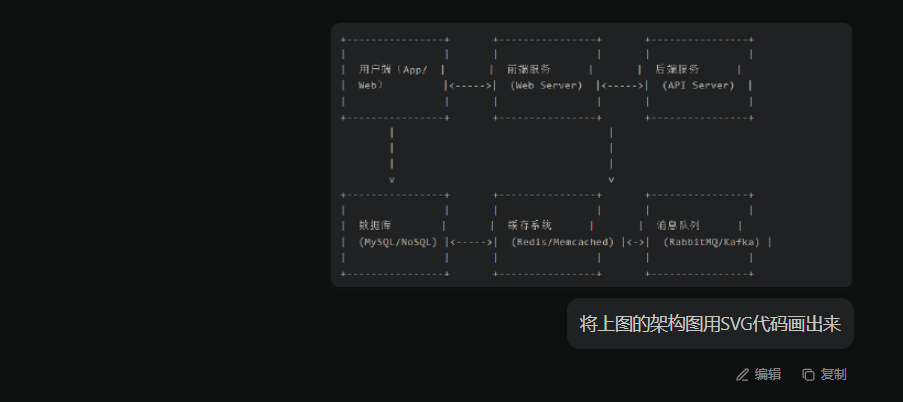
首先将相关文档、文字描述等给AI,让AI用文字拼成一个架构图,复制下来架构图做简单修改,修改之后将文字拼成的截图给AI,让AI根据图片用SVG画出内容
简单实践
第一步
第二步
第三步
为什么选择SVG?
SVG具有以下优点:
- 可缩放性:SVG图形在放大或缩小时不会失真,这对于需要在不同分辨率下查看的架构图非常有用。
- 交互性:SVG可以与JavaScript结合,创建交互式图形。
- 兼容性:SVG被所有现代浏览器支持,无需插件即可查看。
- 编辑性:SVG文件是文本格式,可以使用任何文本编辑器进行编辑。
示例架构图
我们将创建一个简单的电商系统架构图,包括用户端、前端服务、后端服务、数据库、缓存系统和消息队列。
架构图设计
首先,我们需要设计架构图的布局。以下是一个简单的布局:
+----------------+       +----------------+       +----------------+
|                |       |                |       |                |
|  用户端(App/  |       |  前端服务      |       |  后端服务      |
|  Web)         |<----->|  (Web Server)  |<----->|  (API Server)  |
|                |       |                |       |                |
+----------------+       +----------------+       +----------------+
        |                                   |
        |                                   |
        |                                   |
        v                                   v
+----------------+       +----------------+       +----------------+
|                |       |                |       |                |
|  数据库        |       |  缓存系统      |       |  消息队列      |
|  (MySQL/NoSQL) |<----->|  (Redis/Memcached) |<->|  (RabbitMQ/Kafka) |
|                |       |                |       |                |
+----------------+       +----------------+       +----------------+
SVG代码实现
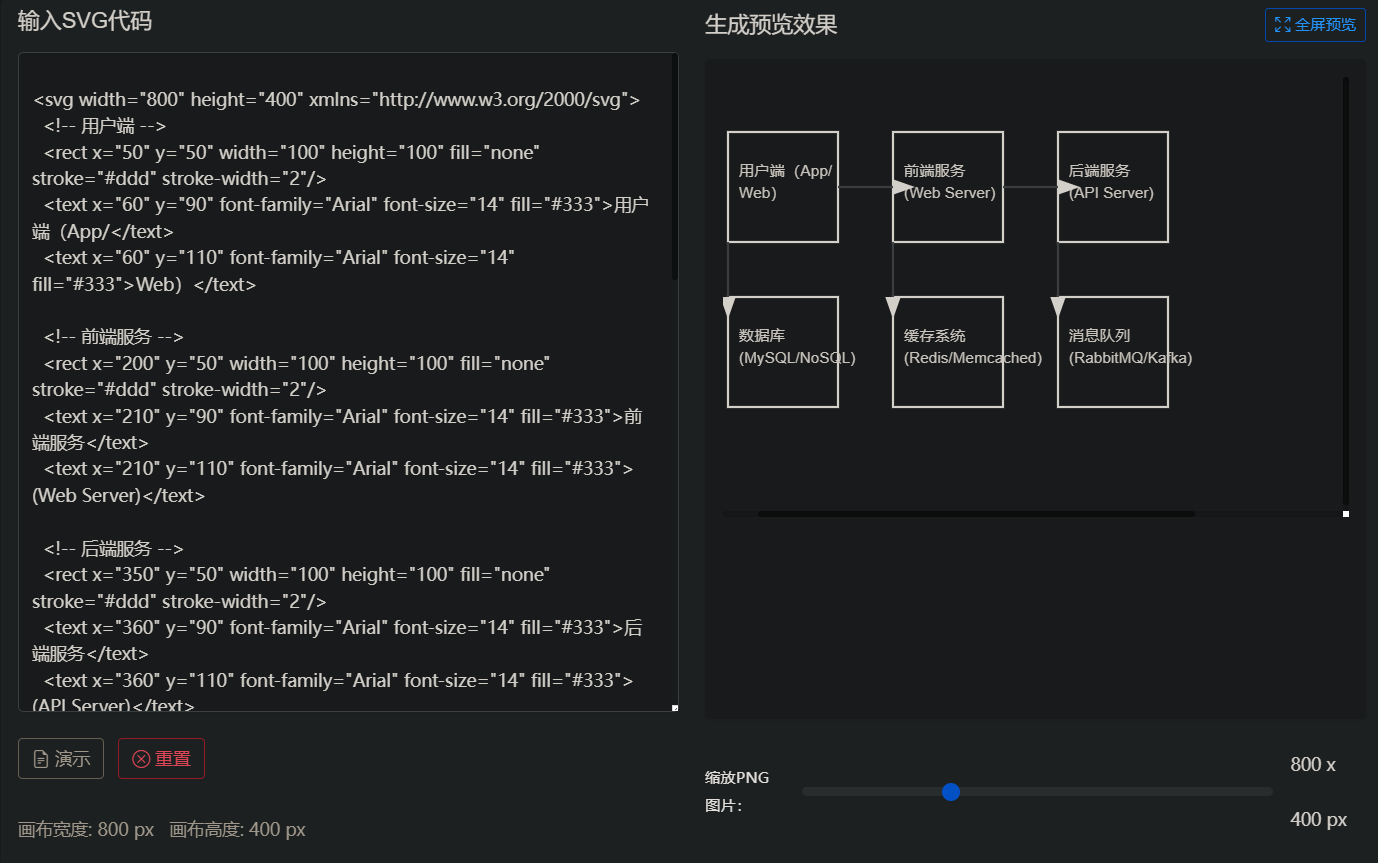
接下来,我们将使用SVG代码来实现这个架构图。以下是完整的SVG代码:
<svg width="800" height="400" xmlns="http://www.w3.org/2000/svg">
  <!-- 用户端 -->
  <rect x="50" y="50" width="100" height="100" fill="none" stroke="#ddd" stroke-width="2"/>
  <text x="60" y="90" font-family="Arial" font-size="14" fill="#333">用户端(App/</text>
  <text x="60" y="110" font-family="Arial" font-size="14" fill="#333">Web)</text>

  <!-- 前端服务 -->
  <rect x="200" y="50" width="100" height="100" fill="none" stroke="#ddd" stroke-width="2"/>
  <text x="210" y="90" font-family="Arial" font-size="14" fill="#333">前端服务</text>
  <text x="210" y="110" font-family="Arial" font-size="14" fill="#333">(Web Server)</text>

  <!-- 后端服务 -->
  <rect x="350" y="50" width="100" height="100" fill="none" stroke="#ddd" stroke-width="2"/>
  <text x="360" y="90" font-family="Arial" font-size="14" fill="#333">后端服务</text>
  <text x="360" y="110" font-family="Arial" font-size="14" fill="#333">(API Server)</text>

  <!-- 数据库 -->
  <rect x="50" y="200" width="100" height="100" fill="none" stroke="#ddd" stroke-width="2"/>
  <text x="60" y="240" font-family="Arial" font-size="14" fill="#333">数据库</text>
  <text x="60" y="260" font-family="Arial" font-size="14" fill="#333">(MySQL/NoSQL)</text>

  <!-- 缓存系统 -->
  <rect x="200" y="200" width="100" height="100" fill="none" stroke="#ddd" stroke-width="2"/>
  <text x="210" y="240" font-family="Arial" font-size="14" fill="#333">缓存系统</text>
  <text x="210" y="260" font-family="Arial" font-size="14" fill="#333">(Redis/Memcached)</text>

  <!-- 消息队列 -->
  <rect x="350" y="200" width="100" height="100" fill="none" stroke="#ddd" stroke-width="2"/>
  <text x="360" y="240" font-family="Arial" font-size="14" fill="#333">消息队列</text>
  <text x="360" y="260" font-family="Arial" font-size="14" fill="#333">(RabbitMQ/Kafka)</text>

  <!-- 连接线 -->
  <line x1="150" y1="100" x2="200" y2="100" stroke="#ddd" stroke-width="2" marker-end="url(#arrowhead)"/>
  <line x1="300" y1="100" x2="350" y2="100" stroke="#ddd" stroke-width="2" marker-end="url(#arrowhead)"/>
  <line x1="50" y1="150" x2="50" y2="200" stroke="#ddd" stroke-width="2" marker-end="url(#arrowhead)"/>
  <line x1="200" y1="150" x2="200" y2="200" stroke="#ddd" stroke-width="2" marker-end="url(#arrowhead)"/>
  <line x1="350" y1="150" x2="350" y2="200" stroke="#ddd" stroke-width="2" marker-end="url(#arrowhead)"/>

  <!-- 箭头 -->
  <defs>
    <marker id="arrowhead" markerWidth="10" markerHeight="7" refX="0" refY="3.5" orient="auto">
      <polygon points="0 0, 10 3.5, 0 7" fill="#ddd"/>
    </marker>
  </defs>
</svg>
如何使用SVG代码
- 复制代码:将上述SVG代码复制到剪贴板。
- 粘贴到HTML文件:创建一个新的HTML文件,并将SVG代码粘贴到
<body>标签中。 - 查看效果:在浏览器中打开HTML文件,你将看到一个清晰的架构图。
结论
使用SVG绘制架构图是一种简单而有效的方法。它不仅提供了高度的可定制性,还确保了图形的清晰度和可缩放性。希望这篇文章能帮助你开始使用SVG来创建自己的架构图。


 被折叠的 条评论
为什么被折叠?
被折叠的 条评论
为什么被折叠?
 到【灌水乐园】发言


