


———————————————————————————————
前情提要
上一期我们讲了如何在一个图窗下同时绘制多个子图,今天我们将实现如何让多子图同时运动
函数介绍

MATLAB官网描述:
https://ww2.mathworks.cn/help/matlab/ref/subplot.html?searchHighlight=subplot&s_tid=srchtitle_support_results_1_subplot
———————————————————————————————
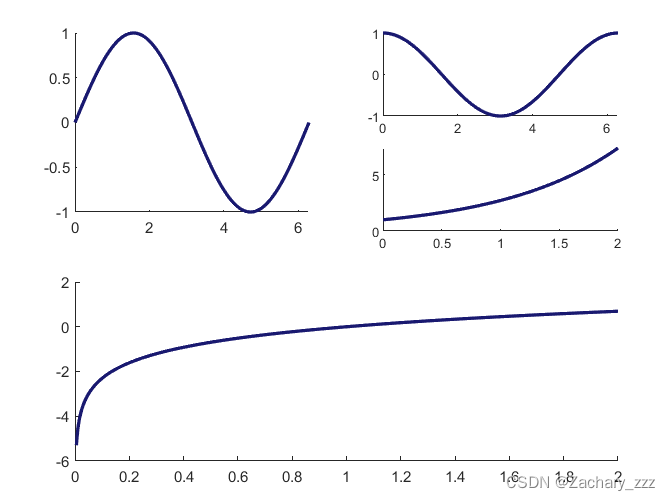
上一期内容–四子图–静态
代码展示
clc;clear
%% 第一个子图窗口
subplot(2,2,1); % 创建
hold on
x1 = linspace(0,2*pi,400);
y1 = sin(x1);
l1 =  plot(x1, y1,'Color','#191970','LineWidth',2);


%% 第二个子图窗口
subplot(4,2,2); % 创建
hold on
x2 = linspace(0,2*pi,400);
y2 = cos(x2);
l2 =  plot(x2, y2,'Color','#191970','LineWidth',2);


%% 第三个子图窗口
subplot(4,2,4); % 创建
hold on
x3 = linspace(0,2,400);
y3 = exp(x3);
l3 =  plot(x3, y3,'Color','#191970','LineWidth',2);

%% 第四个子图窗口
subplot(2,1,2); % 创建
hold on
x4 = linspace(0,2,400);
y4 = log(x4);
l4 =  plot(x4, y4,'Color','#191970','LineWidth',2);
结果演示
———————————————————————————————
本期内容–四子图–动态
代码展示
clc;clear
filename = 'test_2.gif';

figure;
%生成第一张图片,并写入gif文件
frame=getframe(gcf);
imind=frame2im(frame);
[imind,cm]=rgb2ind(imind,256);
imwrite(imind,cm,filename,'gif','Loopcount',0,'DelayTime',0.03);

n = 200;
for i = 1:n
    %% 第一个子图窗口
    subplot(2,2,1); % 创建
    axis([0,2*pi,-1.2,1.2]);% 设置坐标轴
    hold on
    % 绘图
    x1 = linspace(0,2*pi,n);
    y1 = sin(x1);
    if i == 1
        l=plot(x1(i),y1(i),'Color','#483D8B','LineWidth',3);%
        res_x1=x1(i);
        res_y1=y1(i);
    else
        l = plot([res_x1 x1(i)],[res_y1 y1(i)],'Color','#483D8B','LineWidth',3);%
        res_x1=x1(i);
        res_y1=y1(i);
    end

    %% 第二个子图窗口
    subplot(4,2,2); % 创建
    axis([0,2*pi,-1.2,1.2]);% 设置坐标轴
    hold on
    % 绘图
    x2 = linspace(0,2*pi,n);
    y2 = cos(x2);
    if i == 1
        l2=plot(x2(i),y2(i),'Color','#483D8B','LineWidth',3);%
        res_x2=x2(i);
        res_y2=y2(i);
    else
        l2 = plot([res_x2 x2(i)],[res_y2 y2(i)],'Color','#483D8B','LineWidth',3);%
        res_x2=x2(i);
        res_y2=y2(i);
    end


    %% 第三个子图窗口
    subplot(4,2,4); % 创建
    axis([0,5,0,300]);% 设置坐标轴

    hold on
    x3 = linspace(0,5,n);
    y3 = exp(x3);
    if i == 1
        l3=plot(x3(i),y3(i),'Color','#483D8B','LineWidth',3);%
        res_x3=x3(i);
        res_y3=y3(i);
    else
        l3 = plot([res_x3 x3(i)],[res_y3 y3(i)],'Color','#483D8B','LineWidth',3);%
        res_x3=x3(i);
        res_y3=y3(i);
    end

    %% 第四个子图窗口
    subplot(2,1,2); % 创建
    axis([0,2*pi,-2,2]);% 设置坐标轴

    hold on
    x4 = linspace(0,2*pi,n);
    y4 = sin(3.*x4) + (0.5).*sin(4.*x4);
    if i == 1
        l4=plot(x4(i),y4(i),'Color','#483D8B','LineWidth',3);%
        res_x4=x4(i);
        res_y4=y4(i);
    else
        l4 = plot([res_x4 x4(i)],[res_y4 y4(i)],'Color','#483D8B','LineWidth',3);%
        res_x4=x4(i);
        res_y4=y4(i);
    end
    x5 = linspace(0,2*pi,n);
    y5 = sin(3.*x5);
    if i == 1
        l4=plot(x5(i),y5(i),'Color','#483D8B','LineWidth',1);%
        res_x5=x5(i);
        res_y5=y5(i);
    else
        l4 = plot([res_x5 x5(i)],[res_y5 y5(i)],'Color','#483D8B','LineWidth',1);%
        res_x5=x5(i);
        res_y5=y5(i);
    end
    x6 = linspace(0,2*pi,n);
    y6 = sin(4.*x6)-0.5.*sin(3*x6);
    if i == 1
        l4=plot(x6(i),y6(i),'Color','#483D8B','LineWidth',1);%
        res_x6=x6(i);
        res_y6=y6(i);
    else
        l4 = plot([res_x6 x6(i)],[res_y6 y6(i)],'Color','#483D8B','LineWidth',1.7);%
        res_x6=x6(i);
        res_y6=y6(i);
    end
    %生成后续图片,并写入gif文件
    frame=getframe(gcf);
    imind=frame2im(frame);
    [imind,cm]=rgb2ind(imind,256);
    imwrite(imind,cm,filename,'gif','WriteMode','append','DelayTime',0.03);


end
结果演示

代码解析
原理:
此次动态图的绘制,其原理便是在原静态图的基础上,进行多层叠加
代码方面:
便是在原本静态图的代码组上加了个 for 循环;
在每次 for 循环内都重新生成一次多子图的图像;
再将每次生成的静态多子图叠加,边生成了动图。
——————————————————————————
静态:
subplot()

subplot()

subplot()
...
动态:
for
	subplot()

	subplot()

	subplot()
	...
end
此次也在第“四”子图内同时实现了在“一”个子图内的“多”函数绘制
for
	subplot()
	plot()
	subplot()
	plot()
	plot()
	...
	subplot()
	...
end
——————————————————————————————
此次将图片的格式设置为无限重复次播放
%生成第一张图片,并写入gif文件
frame=getframe(gcf);
imind=frame2im(frame);
[imind,cm]=rgb2ind(imind,256);
imwrite(imind,cm,filename,‘gif’,‘Loopcount’,inf,‘DelayTime’,0.03);
这里生成后续的图片,图片生成频率个人认为0.03最佳
frame=getframe(gcf);
imind=frame2im(frame);
[imind,cm]=rgb2ind(imind,256);
imwrite(imind,cm,filename,‘gif’,‘WriteMode’,‘append’,‘DelayTime’,0.03)
——————————————————————————————
写在后面的话
多子图的这个系列应该就告一段落了
下期将介绍
fill 函数,实现数学分析、高等代数中微元法的可视化展示
相信经过下次学习,你能对“微元法”有更形象的认识~


 1347
1347

 被折叠的 条评论
为什么被折叠?
被折叠的 条评论
为什么被折叠?
 到【灌水乐园】发言


