


热力图
所需部分数据如下:我们只需要其中一小部分
| time | latitude | longitude | depth | mag | magType | nst | gap | dmin | rms | net | id | updated | place | type | horizontalError | depthError | magError | magNst | status | locationSource | magSource |
| 2018-05-09T10:41:45.750Z | 36.9902 | 71.3687 | 111.93 | 6.2 | mww | 19 | 0.586 | 1.03 | us | us1000e19e | 2018-05-11T12:36:01.367Z | 36km NW of Ishkashim, Tajikistan | earthquake | 6 | 4.3 | 0.066 | 22 | reviewed | us | us | |
| 2018-05-09T07:57:55.250Z | -5.8916 | 151.7962 | 10 | 6 | mww | 42 | 1.728 | 0.95 | us | us1000e17w | 2018-05-09T20:46:20.040Z | 177km SSW of Kokopo, Papua New Guinea | earthquake | 6.3 | 1.6 | 0.071 | 19 | reviewed | us | us | |
| 2018-05-05T06:19:04.590Z | 14.4969 | 123.9312 | 17.87 | 6.1 | mww | 29 | 7.556 | 1.05 | us | us1000dym9 | 2018-05-11T12:30:01.364Z | 56km NNW of Pandan, Philippines | earthquake | 7.7 | 4.1 | 0.071 | 19 | reviewed | us | us | |
| 2018-05-04T22:32:54.370Z | 19.3127 | -154.998 | 2.06 | 6.9 | mww | 212 | 0.115 | 1.49 | us | us1000dyad | 2018-05-12T08:07:27.820Z | 19km SSW of Leilani Estates, Hawaii | earthquake | 5.5 | 3.6 | 0.056 | 31 | reviewed | hv | us | |
| 2018-05-02T06:32:48.880Z | -24.2596 | -111.654 | 10 | 6 | mww | 38 | 3.514 | 1.33 | us | us1000dw7i | 2018-05-03T16:59:41.040Z | Easter Island region | earthquake | 9.7 | 1.7 | 0.071 | 19 | reviewed | us | us | |
| 2018-04-19T21:09:17.000Z | -42.7797 | 42.1877 | 10 | 6 | mww | 20 | 15.638 | 0.83 | us | us1000dnuj | 2018-04-20T17:56:29.759Z | Prince Edward Islands region | earthquake | 9.6 | 1.7 | 0.042 | 54 | reviewed | us | us | |
| 2018-04-10T10:19:34.030Z | -30.9862 | -71.5566 | 76.08 | 6.2 | mww | 96 | 0.318 | 1.17 | us | us2000dxfc | 2018-05-04T21:11:02.817Z | 54km SW of Ovalle, Chile | earthquake | 7.3 | 5.4 | 0.047 | 44 | reviewed | us | us | |
| 2018-04-07T05:48:40.010Z | -5.8382 | 142.5314 | 18.07 | 6.3 | mww | 19 | 5.796 | 0.84 | us | us2000dvwq | 2018-05-12T05:57:19.008Z | 84km WSW of Porgera, Papua New Guinea | earthquake | 7.1 | 3 | 0.065 | 23 | reviewed | us | us | |
| 2018-04-05T03:53:38.410Z | 6.8325 | 126.7785 | 34 | 6 | mww | 17 | 1.213 | 0.82 | us | us2000dus5 | 2018-05-03T04:46:16.441Z | 43km ESE of Tarragona, Philippines | earthquake | 7.3 | 1.8 | 0.06 | 27 | reviewed | us | us | |
| 2018-04-02T13:40:34.840Z | -20.6588 | -63.0058 | 559 | 6.8 | mww | 16 | 5.32 | 0.99 | us | us1000dce2 | 2018-04-18T16:27:09.697Z | 11km NNE of Carandayti, Bolivia | earthquake | 6.7 | 1.9 | 0.047 | 43 | reviewed | us | us | |
| 2018-04-02T05:57:35.680Z | -24.719 | -176.887 | 92 | 6.1 | mww | 20 | 4.603 | 1.15 | us | us1000dcbs | 2018-05-10T12:39:36.537Z | South of the Fiji Islands | earthquake | 7.5 | 1.8 | 0.045 | 48 | reviewed | us | us | |
| 2018-03-29T21:25:36.790Z | -5.5321 | 151.4999 | 35 | 6.9 | mww | 18 | 1.487 | 1.02 | us | us1000db40 | 2018-05-05T02:10:06.770Z | 150km E of Kimbe, Papua New Guinea | earthquake | 6.6 | 1.8 | 0.057 | 30 | reviewed | us | us | |
| 2018-03-26T09:51:00.430Z | -5.5024 | 151.4025 | 40 | 6.7 | mww | 15 | 1.507 | 1.18 | us | us1000d937 | 2018-05-08T12:55:32.565Z | 139km E of Kimbe, Papua New Guinea | earthquake | 6.5 | 0.8 | 0.049 | 40 | reviewed | us | us | |
| 2018-03-25T20:14:47.710Z | -6.6247 | 129.8138 | 169 | 6.4 | mww | 13 | 1.997 | 1.08 | us | us1000d8xh | 2018-04-29T13:09:39.329Z | 221km NW of Saumlaki, Indonesia | earthquake | 6.5 | 0.7 | 0.033 | 87 | reviewed | us | us | |
| 2018-03-24T19:58:33.380Z | -45.7783 | 96.0692 | 10 | 6 | mww | 29 | 17.781 | 0.75 | us | us1000d8ny | 2018-04-21T00:01:03.800Z | Southeast Indian Ridge | earthquake | 10.1 | 1.7 | 0.054 | 33 | reviewed | us | us | |
| 2018-03-24T11:23:32.050Z | -5.4959 | 151.4971 | 33 | 6.3 | mww | 19 | 5.361 | 0.95 | us | us1000d8k9 | 2018-04-01T05:50:17.694Z | 150km E of Kimbe, Papua New Guinea | earthquake | 7.1 | 1.3 | 0.048 | 42 | reviewed | us | us | |
| 2018-03-08T17:39:51.100Z | -4.3762 | 153.1996 | 22.86 | 6.8 | mww | 16 | 1.049 | 1.05 | us | us1000d1kv | 2018-04-18T14:54:19.326Z | 21km ENE of Taron, Papua New Guinea | earthquake | 6.5 | 3 | 0.046 | 45 | reviewed | us | us | |
| 2018-03-06T14:13:07.650Z | -6.3043 | 142.6116 | 20.49 | 6.7 | mww | 19 | 5.457 | 0.97 | us | us2000dcx1 | 2018-04-26T17:23:17.142Z | 113km SW of Porgera, Papua New Guinea | earthquake | 5.3 | 2.7 | 0.038 | 68 | reviewed | us | us |
Pyecharts代码参数可参考官方文档:地理图表 - pyecharts - A Python Echarts Plotting Library built with love.
其中比较关键的是,分别是标记的大小,每个点模糊的大小,是否启用大规模线图的优化,每个点的大小
symbol_size=4, blur_size=15,is_large= True,point_size=8效果图:

此外如果想要绘制其他地区甚至某省市的地图,只需将maptype更改即可
参数在github上可找到:
pyecharts/pyecharts/datasets/map_filename.json at master · pyecharts/pyecharts (github.com)
源代码:
from pyecharts import options as opts
from pyecharts.charts import Geo
from pyecharts.globals import ChartType
import pandas as pd
from pyecharts.globals import GeoType

def test_geo():
    g = Geo(init_opts=opts.InitOpts(width="1600px", height="1000px"))
    g.add_schema(maptype="world_china_provinces")

    # 1. 从 CSV 文件中读取数据
    df = pd.read_csv('all_2000s_M6plus.csv')

    # 2. 提取经纬度和震级信息
    data_pair = []
    for index, row in df.iterrows():
        longitude = row['longitude']  # 假设经度列名为 'longitude'
        latitude = row['latitude']    # 假设纬度列名为 'latitude'
        magnitude = row['mag']  # 假设震级列名为 'magnitude'

        print(index)
        print(longitude)
        print(latitude)
        print(magnitude)

        # 将经纬度和震级组织成元组,添加到 data_pair 列表中
        g.add_coordinate(index, longitude, latitude)

        data_pair.append((index, magnitude))

    # 将数据添加到地图上
    g.add('', data_pair, type_=GeoType.HEATMAP, symbol_size=4, blur_size=15,is_large= True
          ,point_size=8)
    # 设置样式
    g.set_series_opts(label_opts=opts.LabelOpts(is_show=False))
    # 自定义分段 color 可以用取色器取色
    pieces = [
        {'max': 1, 'label': '1以下', 'color': '#50A3BA'},
        {'min': 1.0, 'max': 4.0, 'label': '1-4', 'color': '#3700A4'},
        {'min': 4.0, 'max': 4.5, 'label': '4-4.5', 'color': '#81AE9F'},
        {'min': 4.5, 'max': 5.5, 'label': '4.5-5.5', 'color': '#E2C568'},
        {'min': 5.5, 'max': 6.0, 'label': '5.5-6', 'color': '#FCF84D'},
        {'min': 6.0, 'max': 6.5, 'label': '6-6.5', 'color': '#DD0200'},
        {'min': 6.5, 'max': 7.0, 'label': '6.5-7', 'color': '#DD675E'},
        {'min': 7, 'label': '7以上', 'color': '#D94E5D'}  # 有下限无上限
    ]
    #  is_piecewise 是否自定义分段, 变为true 才能生效

    g.set_global_opts(

        visualmap_opts=opts.VisualMapOpts(is_piecewise=True, pieces=pieces),
        title_opts=opts.TitleOpts(title="分布"),
    )
    return g

g = test_geo()
g.render("geo_heatmap.html")
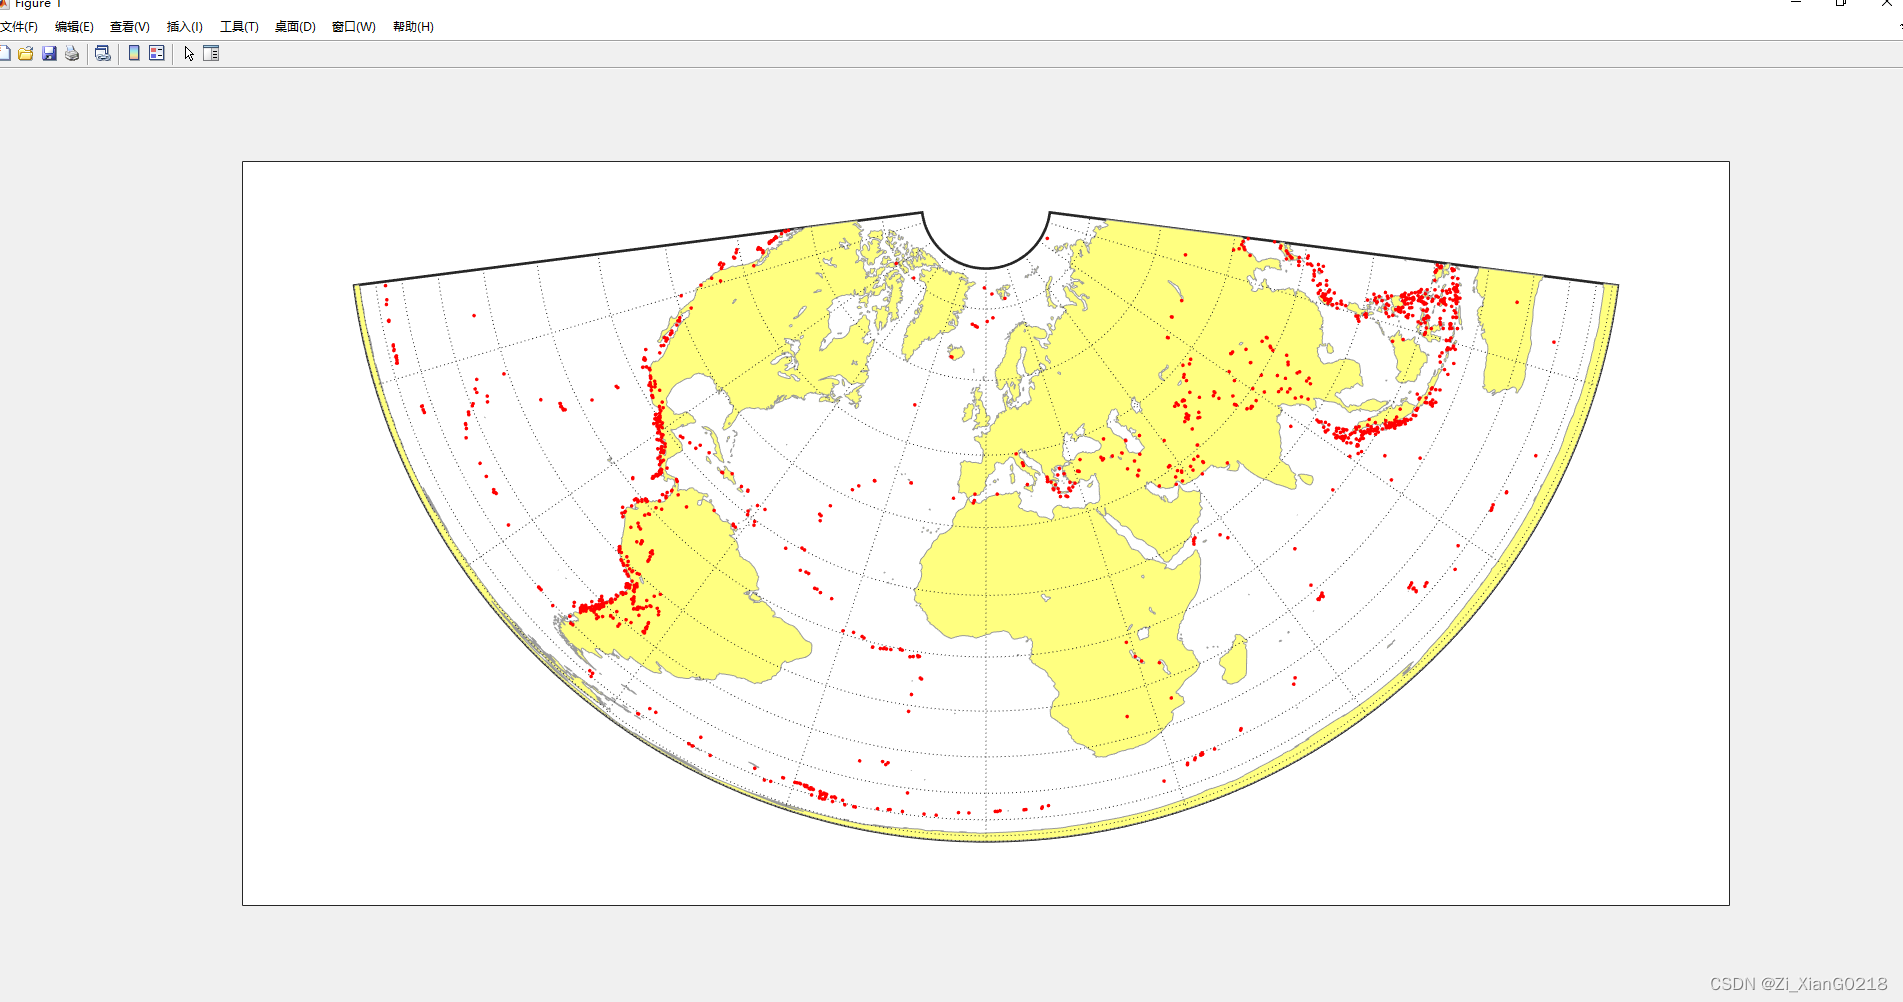
MATLAB绘制不同投影种类的地图
数据沿用上表的经纬度数据
各种种类的图表都可以在官方文档中找到,(但是官方文档不是很好找,我阅读这类文档的速度还是有点慢的)
Summary and Guide to Projections - MATLAB & Simulink - MathWorks 中国

即我们想更换映射类型只需要将
axesm ('eqaconic', 'Frame', 'on', 'Grid', 'on');函数中第一个参数更改成我们所需要的就可以了.
% 读取 CSV 文件中的数据
data = readtable('all_2000s_M6plus.csv'); % 假设 CSV 文件中包含标题行,数据从第二行开始读取

% 提取经纬度数据
latitude = data{:, 2}; % 假设经度列在 CSV 文件中的第二列
longitude = data{:, 3}; % 假设纬度列在 CSV 文件中的第三列

landareas = shaperead('landareas.shp','UseGeoCoords',true);
axesm ('eqaconic', 'Frame', 'on', 'Grid', 'on');
geoshow(landareas,'FaceColor',[1 1 .5],'EdgeColor',[.6 .6 .6]);
% 绘制已知经纬度的散点
lat = 20; % 纬度
lon = 30; % 经度
scatterm(latitude, longitude, 8, 'r', 'filled'); % 标记散点,红色填充

% 添加标签
% textm(lat, lon, '', 'FontSize', 12, 'Color', 'blue');
eqaconic(albers)如下
mercator:

eckert2:


 2499
2499


 被折叠的 条评论
为什么被折叠?
被折叠的 条评论
为什么被折叠?
 到【灌水乐园】发言


