1.引入绘图模块
import matplotlib.pyplot as plt2.matplotlib的图像都位于Figure对象中,然后创建subplot进行绘图
fig = plt.figure()
ax1 = fig.add_subplot(2,2,1)  #两行两列第一幅图
ax2 = fig.add_subplot(2,2,2)
ax3 = fig.add_subplot(2,2,3)
import numpy as np
from numpy.random import randn #randn---N(0,1)正太分布
plt.plot(randn(50).cumsum(),'k--')
ax1.hist(randn(100),bins=20,color='k',alpha=0.3) #直方图
ax2.scatter(np.arange(30),np.arange(30)+3*randn(30)) #散点图
plt.show()3.颜色、标记和线型
#线形图还可以加上一些标记(marker),以强调实际的数据点
plt.plot(randn(30).cumsum(),color='k',linestyle='dashed',marker='o')
plt.show()
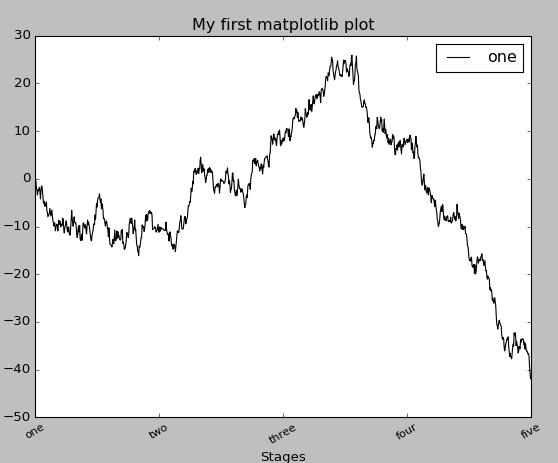
4.设置标题、轴标签、刻度以及刻度标签、图例
fig = plt.figure()
ax = fig.add_subplot(1,1,1)
ax.plot(randn(1000).cumsum(),'k',label='one')
ticks = ax.set_xticks([0,250,500,750,1000])  #刻度
labels = ax.set_xticklabels(['one','two','three','four','five'],rotation=30,fontsize='small') #刻度标签
ax.set_title('My first matplotlib plot')  #标题
ax.set_xlabel('Stages')   #x轴标签
ax.legend(loc='best') #图例
plt.show()
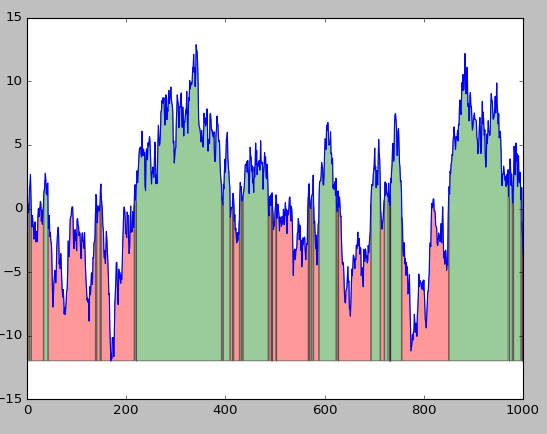
5.根据条件进行着色
#小于均值红色,否则绿色
fig = plt.figure()
ax = fig.add_subplot(111)
x = np.arange(1000)+1
y = randn(1000).cumsum()
ax.plot(x,y)
plt.fill_between(x,y.min(),y,where=y>y.mean(),facecolor="green",alpha=0.4)
plt.fill_between(x,y.min(),y,where=y<y.mean(),facecolor="red",alpha=0.4)
plt.show()
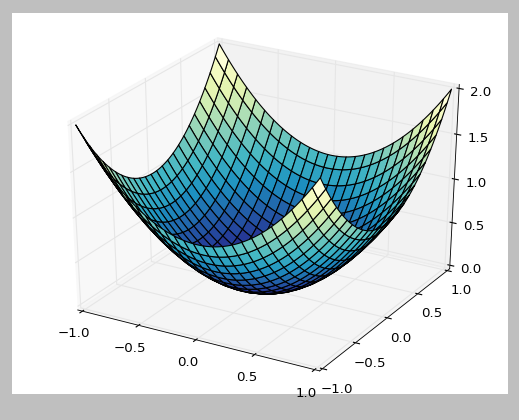
6.在三维空间绘图
from mpl_toolkits.mplot3d import Axes3D
from matplotlib import cm
fig = plt.figure()
ax = fig.add_subplot(111,projection='3d')
u = np.linspace(-1,1,100)
x,y = np.meshgrid(u,u)    #meshgrid函数创建一个二维的坐标网络
z = x**2 + y**2
ax.plot_surface(x,y,z,rstride=4,cstride=4,cmap=cm.YlGnBu_r)
plt.show()
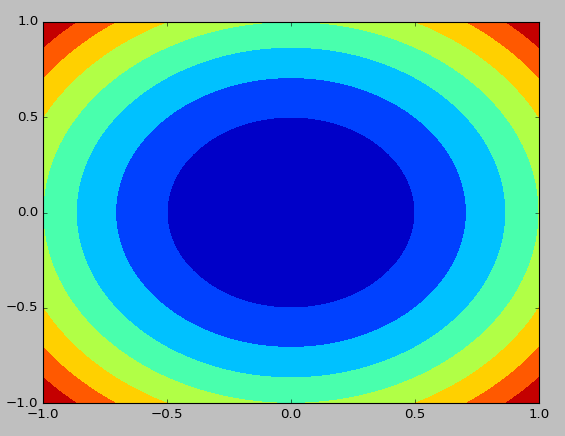
7.等高线图
fig = plt.figure()
ax = fig.add_subplot(111)
u = np.linspace(-1,1,100)
x,y = np.meshgrid(u,u)
z = x**2 + y**2
ax.contourf(x,y,z)
plt.show()
8.将图表保存到文件
plt.savefig("plot.png")


 2764
2764

 被折叠的 条评论
为什么被折叠?


