


首先导入工具包, 构造正态分布
import numpy as np
import seaborn as sns
import matplotlib.pyplot as plt
import warnings
warnings.filterwarnings("ignore")
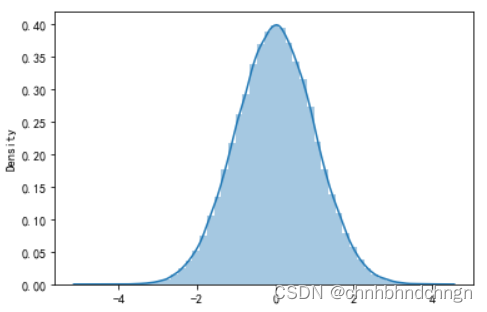
# 正态分布
N = np.random.normal(0, 1, 100000)
plt.figure(figsize=(6, 4))
sns.distplot(N)如图
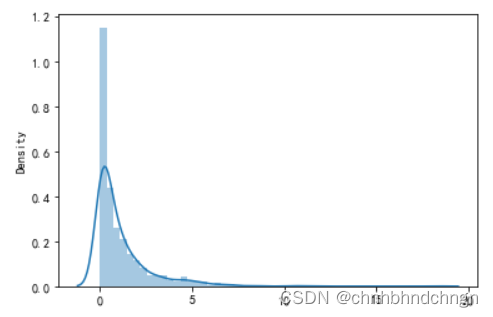
构造自由度为1的卡方分布
# 自由度为1 的卡方分布
ka_1 = [np.random.choice(N, 1)[0] ** 2 for i in range(1000)]
print(ka_1[:5])
plt.figure(figsize=(6, 4))
sns.distplot(ka_1)
如图
构造不同自由度的卡方数据
# 自由度为 2, 3, 5, 7, 10 的卡方分布

ka_2 = []
ka_3 = []
ka_5 = []
ka_10 = []
ka_20 = []
for i in range(1000):
    ka_2.append(  np.sum(np.random.choice(N, 2) ** 2)   )
    ka_3.append(  np.sum(np.random.choice(N, 3) ** 2)   )
    ka_5.append(  np.sum(np.random.choice(N, 5) ** 2)   )
    ka_10.append(  np.sum(np.random.choice(N, 10) ** 2)  )
    ka_20.append(  np.sum(np.random.choice(N, 20) ** 2)   )

plt.figure(figsize=(10, 6))
sns.distplot(N, label='正态')
sns.distplot(ka_3, label='3')
sns.distplot(ka_5, label='5')
sns.distplot(ka_10, label='10')
sns.distplot(ka_20, label='50')
plt.legend()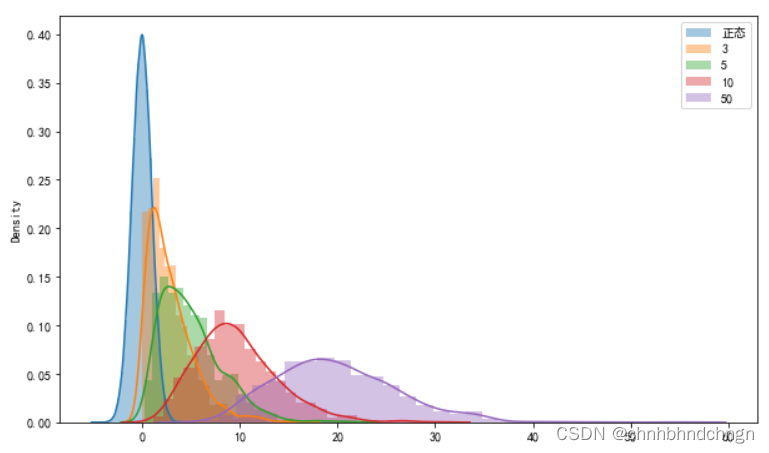


 4032
4032

 被折叠的 条评论
为什么被折叠?
被折叠的 条评论
为什么被折叠?
 到【灌水乐园】发言


