


作者制作不易,关注、点赞、收藏一下吧!
目录
1.下载并导入matplotlib
1.1.下载matplotlib
输入指令:
pip install matplotlib即可。
1.2.导入matplotlib
在.py文件中输入:
from matplotlib import*
# 或者 import matplotlib
2.单式折线统计图
2.1.绘制过程
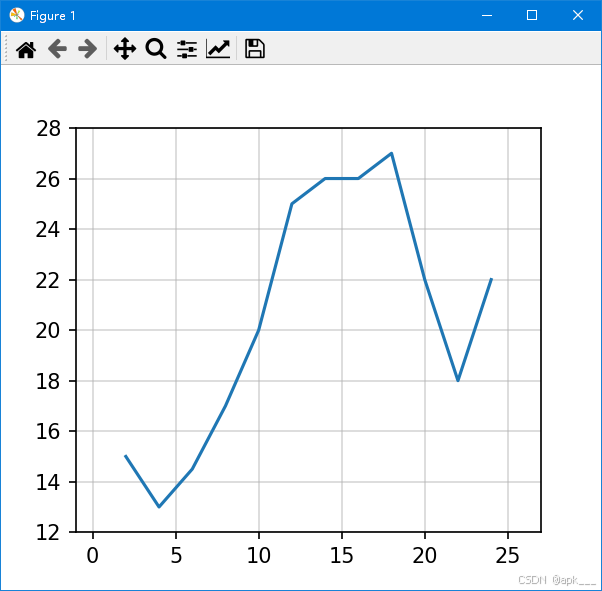
例如,我们想统计某市一段时间内的天气变化,那么,我们需要使用单式折线统计图。
首先,我们要导入绘图模块:
import matplotlib.pyplot as plt # 导入绘图模块再准备好气温的数据:
x = range(2,26,2) # X轴
y = [15,13,14.5,17,20,25,26,26,27,22,18,22] # Y轴
然后,就要定义绘图类和函数了。
这里,我把绘图类叫做Draw,而函数叫做draw_LineChart。
class Draw: # 定义 c绘图 类
    def __init__(self):
        pass

    def draw_LineChart(self, x, y): # 绘制单式折线图
        plt.figure(figsize = (4, 3.5), dpi = 150) # 使用plt.figure函数设置图片大小,图片大小为4*3.5,每英寸150个像素点。
        plt.xlim(-1, 27)
        plt.ylim(12, 28)
        # 设置网格
        plt.grid(alpha = 0.5)
        # 绘图
        plt.plot(x, y) # 绘图。 plt.plot(x, y, label = '图例')
        # plt.savefig("./t1.png") # 将图片保存到本地,引号里为文件路径和文件名( ./ 代表当前路径,png为文件后缀/格式)。
        plt.show() # 绘制
再创建对象:
line = Draw()最后,绘制出折线统计图:
line.draw_LineChart(x_LC1,y_LC1)运行结果:
 最低0.47元/天 解锁文章


 被折叠的 条评论
为什么被折叠?
被折叠的 条评论
为什么被折叠?
 到【灌水乐园】发言


