


测试环境:
PolarDB-X 标准版:16C64G(1台)
RDS MySQL5.7: 16C64G(4台)
ECS 压测机: 8C16G(1台)
sysbench 0.5
第一轮测试:每个测试都是200个线程。
测试一:
直连RDS,4张表,每个表1亿条记录,不分库不分表。
/usr/local/bin/sysbench --test='/usr/local/share/sysbench/oltp.lua' --oltp_tables_count=4 --oltp-table-size=100000000  --mysql-user=sysbenchuser --mysql-password=sysbenchuser --mysql-table-engine=innodb  --rand-init=on --report-interval=3 --mysql-host=hlj-prt-mdb.mysql.rds.aliyuncs.com --mysql-port=3306 --mysql-db=sysbenchtest --max-time=60 --max-requests=0   --oltp_skip_trx=on --oltp_auto_inc=off --oltp_secondary --oltp_range_size=5  --num-threads=200 run
sysbench 0.5:  multi-threaded system evaluation benchmark
Running the test with following options:
Number of threads: 200
Report intermediate results every 3 second(s)
Initializing random number generator from timer.
Random number generator seed is 0 and will be ignored
Initializing worker threads...
Threads started!
[   3s] threads: 200, tps: 0.00, reads: 35121.22, writes: 9899.91, response time: 95.53ms (95%), errors: 0.00, reconnects:  0.00
[   6s] threads: 200, tps: 0.00, reads: 36623.53, writes: 10471.39, response time: 93.21ms (95%), errors: 0.00, reconnects:  0.00
[   9s] threads: 200, tps: 0.00, reads: 38857.31, writes: 11098.33, response time: 91.01ms (95%), errors: 0.00, reconnects:  0.00
[  12s] threads: 200, tps: 0.00, reads: 40289.99, writes: 11509.33, response time: 89.09ms (95%), errors: 0.00, reconnects:  0.00
[  15s] threads: 200, tps: 0.00, reads: 41951.67, writes: 11984.34, response time: 87.09ms (95%), errors: 0.00, reconnects:  0.00
[  18s] threads: 200, tps: 0.00, reads: 43503.34, writes: 12434.34, response time: 85.10ms (95%), errors: 0.00, reconnects:  0.00
[  21s] threads: 200, tps: 0.00, reads: 46729.02, writes: 13347.34, response time: 82.79ms (95%), errors: 0.00, reconnects:  0.00
[  24s] threads: 200, tps: 0.00, reads: 48667.65, writes: 13903.66, response time: 79.63ms (95%), errors: 0.00, reconnects:  0.00
[  27s] threads: 200, tps: 0.00, reads: 50768.68, writes: 14499.34, response time: 77.24ms (95%), errors: 0.00, reconnects:  0.00
[  30s] threads: 200, tps: 0.00, reads: 52842.09, writes: 15105.69, response time: 74.09ms (95%), errors: 0.00, reconnects:  0.00
[  33s] threads: 200, tps: 0.00, reads: 54972.28, writes: 15696.32, response time: 72.49ms (95%), errors: 0.00, reconnects:  0.00
[  36s] threads: 200, tps: 0.00, reads: 57911.96, writes: 16577.99, response time: 67.97ms (95%), errors: 0.00, reconnects:  0.00
[  39s] threads: 200, tps: 0.00, reads: 59676.35, writes: 17041.34, response time: 65.69ms (95%), errors: 0.00, reconnects:  0.00
[  42s] threads: 200, tps: 0.00, reads: 62559.01, writes: 17867.34, response time: 62.77ms (95%), errors: 0.00, reconnects:  0.00
[  45s] threads: 200, tps: 0.00, reads: 65862.65, writes: 18814.33, response time: 59.92ms (95%), errors: 0.00, reconnects:  0.00
[  48s] threads: 200, tps: 0.00, reads: 68973.26, writes: 19706.65, response time: 60.12ms (95%), errors: 0.00, reconnects:  0.00
[  51s] threads: 200, tps: 0.00, reads: 72180.64, writes: 20611.32, response time: 52.28ms (95%), errors: 0.00, reconnects:  0.00
[  54s] threads: 200, tps: 0.00, reads: 73741.65, writes: 21079.00, response time: 52.53ms (95%), errors: 0.00, reconnects:  0.00
[  57s] threads: 200, tps: 0.00, reads: 76477.44, writes: 21851.36, response time: 48.45ms (95%), errors: 0.00, reconnects:  0.00
[  60s] threads: 200, tps: 0.00, reads: 78737.13, writes: 22510.28, response time: 45.08ms (95%), errors: 0.00, reconnects:  0.00
OLTP test statistics:
    queries performed:
        read:                            3320520
        write:                           948720
        other:                           0
        total:                           4269240
    transactions:                        0      (0.00 per sec.)
    read/write requests:                 4269240 (71114.30 per sec.)
    other operations:                    0      (0.00 per sec.)
    ignored errors:                      0      (0.00 per sec.)
    reconnects:                          0      (0.00 per sec.)
General statistics:
    total time:                          60.0335s
    total number of events:              237180
    total time taken by event execution: 12003.1106s
    response time:
         min:                                 29.04ms
         avg:                                 50.61ms
         max:                                105.61ms
         approx.  95 percentile:              88.48ms
Threads fairness:
    events (avg/stddev):           1185.9000/47.77
    execution time (avg/stddev):   60.0156/0.01
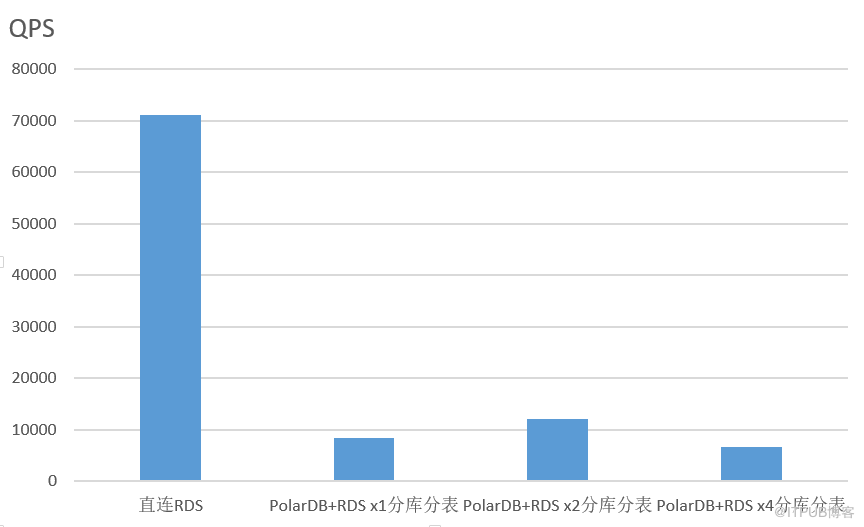
平均QPS为71114,平均响应时间50ms
测试二:
PolarDB-X+RDS x 1 分库分表,4张表,每个表1亿条记录。
/usr/local/bin/sysbench --test='/usr/local/share/sysbench/oltp.lua' --oltp_tables_count=4 --oltp-table-size=100000000  --mysql-user=sysbenchuser --mysql-password=sysbenchuser_123 --mysql-table-engine=innodb  --rand-init=on --report-interval=3 --mysql-host=drdsbggamlqgcm2o.drds.aliyuncs.com --mysql-port=3306 --mysql-db=polardb_test --max-time=60 --max-requests=0 --oltp_skip_trx=on --oltp_auto_inc=off --oltp_secondary --oltp_range_size=5 --mysql_table_options='dbpartition by hash(`id`) tbpartition by hash(`id`) tbpartitions 4' --num-threads=200 run
sysbench 0.5:  multi-threaded system evaluation benchmark
Running the test with following options:
Number of threads: 200
Report intermediate results every 3 second(s)
Initializing random number generator from timer.
Random number generator seed is 0 and will be ignored
Initializing worker threads...
Threads started!
[   3s] threads: 200, tps: 0.00, reads: 5542.87, writes: 1411.30, response time: 711.51ms (95%), errors: 0.00, reconnects:  0.00
[   6s] threads: 200, tps: 0.00, reads: 5484.34, writes: 1575.00, response time: 606.40ms (95%), errors: 0.00, reconnects:  0.00
[   9s] threads: 200, tps: 0.00, reads: 5669.67, writes: 1621.33, response time: 583.60ms (95%), errors: 0.00, reconnects:  0.00
[  12s] threads: 200, tps: 0.00, reads: 5607.67, writes: 1604.67, response time: 594.00ms (95%), errors: 0.00, reconnects:  0.00
[  15s] threads: 200, tps: 0.00, reads: 5906.00, writes: 1681.33, response time: 583.78ms (95%), errors: 0.00, reconnects:  0.00
[  18s] threads: 200, tps: 0.00, reads: 6055.00, writes: 1726.33, response time: 535.08ms (95%), errors: 0.00, reconnects:  0.00
[  21s] threads: 200, tps: 0.00, reads: 6016.99, writes: 1728.00, response time: 575.62ms (95%), errors: 0.00, reconnects:  0.00
[  24s] threads: 200, tps: 0.00, reads: 6150.01, writes: 1742.34, response time: 522.26ms (95%), errors: 0.00, reconnects:  0.00
[  27s] threads: 200, tps: 0.00, reads: 6251.33, writes: 1793.33, response time: 524.14ms (95%), errors: 0.00, reconnects:  0.00
[  30s] threads: 200, tps: 0.00, reads: 6454.33, writes: 1849.33, response time: 561.16ms (95%), errors: 0.00, reconnects:  0.00
[  33s] threads: 200, tps: 0.00, reads: 6600.33, writes: 1881.00, response time: 500.38ms (95%), errors: 0.00, reconnects:  0.00
[  36s] threads: 200, tps: 0.00, reads: 6942.67, writes: 1991.33, response time: 497.24ms (95%), errors: 0.00, reconnects:  0.00
[  39s] threads: 200, tps: 0.00, reads: 6887.66, writes: 1947.67, response time: 486.20ms (95%), errors: 0.00, reconnects:  0.00
[  42s] threads: 200, tps: 0.00, reads: 7042.99, writes: 2033.66, response time: 487.81ms (95%), errors: 0.00, reconnects:  0.00
[  45s] threads: 200, tps: 0.00, reads: 6985.34, writes: 1979.67, response time: 487.95ms (95%), errors: 0.00, reconnects:  0.00
[  48s] threads: 200, tps: 0.00, reads: 7396.34, writes: 2114.67, response time: 467.93ms (95%), errors: 0.00, reconnects:  0.00
[  51s] threads: 200, tps: 0.00, reads: 7531.00, writes: 2163.33, response time: 442.72ms (95%), errors: 0.00, reconnects:  0.00
[  54s] threads: 200, tps: 0.00, reads: 7671.00, writes: 2193.67, response time: 413.26ms (95%), errors: 0.00, reconnects:  0.00
[  57s] threads: 200, tps: 0.00, reads: 7673.67, writes: 2187.67, response time: 441.13ms (95%), errors: 0.00, reconnects:  0.00
[  60s] threads: 200, tps: 0.00, reads: 7929.32, writes: 2274.33, response time: 415.00ms (95%), errors: 0.00, reconnects:  0.00
OLTP test statistics:
    queries performed:
        read:                            396438
        write:                           113268
        other:                           0
        total:                           509706
    transactions:                        0      (0.00 per sec.)
    read/write requests:                 509706 (8457.83 per sec.)
    other operations:                    0      (0.00 per sec.)
    ignored errors:                      0      (0.00 per sec.)
    reconnects:                          0      (0.00 per sec.)
General statistics:
    total time:                          60.2644s
    total number of events:              28317
    total time taken by event execution: 12029.9104s
    response time:
         min:                                204.91ms
         avg:                                424.83ms
         max:                                877.59ms
         approx.  95 percentile:             569.28ms
Threads fairness:
    events (avg/stddev):           141.5850/2.88
    execution time (avg/stddev):   60.1496/0.08
平均QPS为8457,平均响应时间400ms
测试三:
PolarDB-X+RDS x 2 分库分表,4张表,每个表1亿条记录。
/usr/local/bin/sysbench --test='/usr/local/share/sysbench/oltp.lua' --oltp_tables_count=4 --oltp-table-size=100000000  --mysql-user=sysbenchuser --mysql-password=sysbenchuser_123 --mysql-table-engine=innodb  --rand-init=on --report-interval=3 --mysql-host=drdsbggamlqgcm2o.drds.aliyuncs.com --mysql-port=3306 --mysql-db=polardb1 --max-time=60 --max-requests=0 --oltp_skip_trx=on --oltp_auto_inc=off --oltp_secondary --oltp_range_size=5 --mysql_table_options='dbpartition by hash(`id`) tbpartition by hash(`id`) tbpartitions 4' --num-threads=200 run
sysbench 0.5:  multi-threaded system evaluation benchmark
Running the test with following options:
Number of threads: 200
Report intermediate results every 3 second(s)
Initializing random number generator from timer.
Random number generator seed is 0 and will be ignored
Initializing worker threads...
Threads started!
[   3s] threads: 200, tps: 0.00, reads: 9783.44, writes: 2636.60, response time: 331.45ms (95%), errors: 0.00, reconnects:  0.00
[   6s] threads: 200, tps: 0.00, reads: 9526.69, writes: 2725.01, response time: 349.90ms (95%), errors: 0.00, reconnects:  0.00
[   9s] threads: 200, tps: 0.00, reads: 9463.33, writes: 2691.00, response time: 365.42ms (95%), errors: 0.00, reconnects:  0.00
[  12s] threads: 200, tps: 0.00, reads: 9338.67, writes: 2666.67, response time: 372.71ms (95%), errors: 0.00, reconnects:  0.00
[  15s] threads: 200, tps: 0.00, reads: 9568.67, writes: 2753.67, response time: 352.95ms (95%), errors: 0.00, reconnects:  0.00
[  18s] threads: 200, tps: 0.00, reads: 9289.00, writes: 2630.67, response time: 365.09ms (95%), errors: 0.00, reconnects:  0.00
[  21s] threads: 200, tps: 0.00, reads: 9228.33, writes: 2637.67, response time: 378.22ms (95%), errors: 0.00, reconnects:  0.00
[  24s] threads: 200, tps: 0.00, reads: 9149.34, writes: 2623.67, response time: 385.54ms (95%), errors: 0.00, reconnects:  0.00
[  27s] threads: 200, tps: 0.00, reads: 9132.33, writes: 2608.33, response time: 391.12ms (95%), errors: 0.00, reconnects:  0.00
[  30s] threads: 200, tps: 0.00, reads: 9197.67, writes: 2627.00, response time: 383.81ms (95%), errors: 0.00, reconnects:  0.00
[  33s] threads: 200, tps: 0.00, reads: 9023.33, writes: 2576.33, response time: 394.29ms (95%), errors: 0.00, reconnects:  0.00
[  36s] threads: 200, tps: 0.00, reads: 9373.00, writes: 2671.33, response time: 369.16ms (95%), errors: 0.00, reconnects:  0.00
[  39s] threads: 200, tps: 0.00, reads: 9406.66, writes: 2710.33, response time: 355.60ms (95%), errors: 0.00, reconnects:  0.00
[  42s] threads: 200, tps: 0.00, reads: 9304.33, writes: 2647.33, response time: 370.49ms (95%), errors: 0.00, reconnects:  0.00
[  45s] threads: 200, tps: 0.00, reads: 9509.34, writes: 2712.00, response time: 359.46ms (95%), errors: 0.00, reconnects:  0.00
[  48s] threads: 200, tps: 0.00, reads: 9333.00, writes: 2671.33, response time: 373.72ms (95%), errors: 0.00, reconnects:  0.00
[  51s] threads: 200, tps: 0.00, reads: 9337.67, writes: 2660.00, response time: 363.68ms (95%), errors: 0.00, reconnects:  0.00
[  54s] threads: 200, tps: 0.00, reads: 9463.33, writes: 2697.67, response time: 363.02ms (95%), errors: 0.00, reconnects:  0.00
[  57s] threads: 200, tps: 0.00, reads: 9074.00, writes: 2607.00, response time: 379.58ms (95%), errors: 0.00, reconnects:  0.00
[  60s] threads: 200, tps: 0.00, reads: 9290.33, writes: 2651.33, response time: 371.16ms (95%), errors: 0.00, reconnects:  0.00
OLTP test statistics:
    queries performed:
        read:                            561302
        write:                           160372
        other:                           0
        total:                           721674
    transactions:                        0      (0.00 per sec.)
    read/write requests:                 721674 (11985.81 per sec.)
    other operations:                    0      (0.00 per sec.)
    ignored errors:                      0      (0.00 per sec.)
    reconnects:                          0      (0.00 per sec.)
General statistics:
    total time:                          60.2107s
    total number of events:              40093
    total time taken by event execution: 12021.4918s
    response time:
         min:                                179.64ms
         avg:                                299.84ms
         max:                                561.19ms
         approx.  95 percentile:             370.38ms
Threads fairness:
    events (avg/stddev):           200.4650/5.07
    execution time (avg/stddev):   60.1075/0.06
平均QPS为11985, 平均响应时间299ms
测试四:
PolarDB-X+RDS x 4 分库分表,4张表,每个表1亿条记录。
/usr/local/bin/sysbench --test='/usr/local/share/sysbench/oltp.lua' --oltp_tables_count=4 --oltp-table-size=100000000  --mysql-user=sysbenchuser --mysql-password=sysbenchuser_123 --mysql-table-engine=innodb  --rand-init=on --report-interval=3 --mysql-host=drdsbggamlqgcm2o.drds.aliyuncs.com --mysql-port=3306 --mysql-db=polardb2 --max-time=60 --max-requests=0 --oltp_skip_trx=on --oltp_auto_inc=off --oltp_secondary --oltp_range_size=5 --mysql_table_options='dbpartition by hash(`id`) tbpartition by hash(`id`) tbpartitions 4' --num-threads=200 run
sysbench 0.5:  multi-threaded system evaluation benchmark
Running the test with following options:
Number of threads: 200
Report intermediate results every 3 second(s)
Initializing random number generator from timer.
Random number generator seed is 0 and will be ignored
Initializing worker threads...
Threads started!
[   3s] threads: 200, tps: 0.00, reads: 5184.88, writes: 1333.97, response time: 800.57ms (95%), errors: 0.00, reconnects:  0.00
[   6s] threads: 200, tps: 0.00, reads: 5109.34, writes: 1415.33, response time: 707.68ms (95%), errors: 0.00, reconnects:  0.00
[   9s] threads: 200, tps: 0.00, reads: 5229.67, writes: 1508.33, response time: 677.62ms (95%), errors: 0.00, reconnects:  0.00
[  12s] threads: 200, tps: 0.00, reads: 5150.67, writes: 1463.67, response time: 673.18ms (95%), errors: 0.00, reconnects:  0.00
[  15s] threads: 200, tps: 0.00, reads: 5141.00, writes: 1485.33, response time: 652.35ms (95%), errors: 0.00, reconnects:  0.00
[  18s] threads: 200, tps: 0.00, reads: 5001.00, writes: 1445.00, response time: 769.09ms (95%), errors: 0.00, reconnects:  0.00
[  21s] threads: 200, tps: 0.00, reads: 5178.00, writes: 1428.33, response time: 656.26ms (95%), errors: 0.00, reconnects:  0.00
[  24s] threads: 200, tps: 0.00, reads: 4920.00, writes: 1420.00, response time: 720.51ms (95%), errors: 0.00, reconnects:  0.00
[  27s] threads: 200, tps: 0.00, reads: 5181.33, writes: 1509.00, response time: 657.05ms (95%), errors: 0.00, reconnects:  0.00
[  30s] threads: 200, tps: 0.00, reads: 4937.00, writes: 1379.67, response time: 682.92ms (95%), errors: 0.00, reconnects:  0.00
[  33s] threads: 200, tps: 0.00, reads: 4822.67, writes: 1390.00, response time: 810.21ms (95%), errors: 0.00, reconnects:  0.00
[  36s] threads: 200, tps: 0.00, reads: 5132.00, writes: 1465.67, response time: 662.98ms (95%), errors: 0.00, reconnects:  0.00
[  39s] threads: 200, tps: 0.00, reads: 5282.34, writes: 1493.00, response time: 679.04ms (95%), errors: 0.00, reconnects:  0.00
[  42s] threads: 200, tps: 0.00, reads: 5186.00, writes: 1503.67, response time: 698.84ms (95%), errors: 0.00, reconnects:  0.00
[  45s] threads: 200, tps: 0.00, reads: 5102.67, writes: 1474.33, response time: 662.78ms (95%), errors: 0.00, reconnects:  0.00
[  48s] threads: 200, tps: 0.00, reads: 5270.66, writes: 1478.33, response time: 647.68ms (95%), errors: 0.00, reconnects:  0.00
[  51s] threads: 200, tps: 0.00, reads: 5070.00, writes: 1459.67, response time: 764.73ms (95%), errors: 0.00, reconnects:  0.00
[  54s] threads: 200, tps: 0.00, reads: 5276.66, writes: 1490.67, response time: 650.59ms (95%), errors: 0.00, reconnects:  0.00
[  57s] threads: 200, tps: 0.00, reads: 5154.00, writes: 1518.67, response time: 652.15ms (95%), errors: 0.00, reconnects:  0.00
[  60s] threads: 200, tps: 0.00, reads: 5150.33, writes: 1441.00, response time: 708.74ms (95%), errors: 0.00, reconnects:  0.00
OLTP test statistics:
    queries performed:
        read:                            308308
        write:                           88088
        other:                           0
        total:                           396396
    transactions:                        0      (0.00 per sec.)
    read/write requests:                 396396 (6561.20 per sec.)
    other operations:                    0      (0.00 per sec.)
    ignored errors:                      0      (0.00 per sec.)
    reconnects:                          0      (0.00 per sec.)
General statistics:
    total time:                          60.4152s
    total number of events:              22022
    total time taken by event execution: 12051.0624s
    response time:
         min:                                301.99ms
         avg:                                547.23ms
         max:                                964.61ms
         approx.  95 percentile:             695.50ms
Threads fairness:
    events (avg/stddev):           110.1100/3.65
    execution time (avg/stddev):   60.2553/0.12
平均QPS为6561, 平均响应时间547ms。
第一轮测试,压测机、polardb-x和RDS资源使用率都没达到瓶颈。
第二轮测试: 每个测试都是500个线程。
测试一:
直连RDS,4张表,每个表1亿条记录,不分库不分表。
/usr/local/bin/sysbench --test='/usr/local/share/sysbench/oltp.lua' --oltp_tables_count=4 --oltp-table-size=100000000  --mysql-user=sysbenchuser --mysql-password=sysbenchuser --mysql-table-engine=innodb  --rand-init=on --report-interval=3 --mysql-host=hlj-prt-mdb.mysql.rds.aliyuncs.com --mysql-port=3306 --mysql-db=sysbenchtest --max-time=60 --max-requests=0   --oltp_skip_trx=on --oltp_auto_inc=off --oltp_secondary --oltp_range_size=5  --num-threads=500 run
sysbench 0.5:  multi-threaded system evaluation benchmark
Running the test with following options:
Number of threads: 500
Report intermediate results every 3 second(s)
Initializing random number generator from timer.
Random number generator seed is 0 and will be ignored
Initializing worker threads...
Threads started!
[   3s] threads: 500, tps: 0.00, reads: 62887.16, writes: 17650.86, response time: 184.83ms (95%), errors: 0.00, reconnects:  0.00
[   6s] threads: 500, tps: 0.00, reads: 63088.95, writes: 17995.41, response time: 201.78ms (95%), errors: 0.00, reconnects:  0.00
[   9s] threads: 500, tps: 0.00, reads: 63634.72, writes: 18174.59, response time: 217.07ms (95%), errors: 0.00, reconnects:  0.00
[  12s] threads: 500, tps: 0.00, reads: 63543.61, writes: 18181.65, response time: 217.07ms (95%), errors: 0.00, reconnects:  0.00
[  15s] threads: 500, tps: 0.00, reads: 64176.98, writes: 18301.76, response time: 194.60ms (95%), errors: 0.00, reconnects:  0.00
[  18s] threads: 500, tps: 0.00, reads: 65004.58, writes: 18590.97, response time: 206.17ms (95%), errors: 0.00, reconnects:  0.00
[  21s] threads: 500, tps: 0.00, reads: 66744.87, writes: 19039.63, response time: 196.83ms (95%), errors: 0.00, reconnects:  0.00
[  24s] threads: 500, tps: 0.00, reads: 68925.86, writes: 19732.39, response time: 197.06ms (95%), errors: 0.00, reconnects:  0.00
[  27s] threads: 500, tps: 0.00, reads: 69555.18, writes: 19867.96, response time: 191.59ms (95%), errors: 0.00, reconnects:  0.00
[  30s] threads: 500, tps: 0.00, reads: 70839.85, writes: 20217.39, response time: 193.61ms (95%), errors: 0.00, reconnects:  0.00
[  33s] threads: 500, tps: 0.00, reads: 73930.37, writes: 21175.68, response time: 178.90ms (95%), errors: 0.00, reconnects:  0.00
[  36s] threads: 500, tps: 0.00, reads: 74597.04, writes: 21291.25, response time: 165.60ms (95%), errors: 0.00, reconnects:  0.00
[  39s] threads: 500, tps: 0.00, reads: 66826.55, writes: 19063.63, response time: 144.39ms (95%), errors: 0.00, reconnects:  0.00
[  42s] threads: 500, tps: 0.00, reads: 63488.00, writes: 18105.24, response time: 143.61ms (95%), errors: 0.00, reconnects:  0.00
[  45s] threads: 500, tps: 0.00, reads: 64581.63, writes: 18527.51, response time: 143.40ms (95%), errors: 0.00, reconnects:  0.00
[  48s] threads: 500, tps: 0.00, reads: 60995.71, writes: 17282.59, response time: 147.14ms (95%), errors: 0.00, reconnects:  0.00
[  51s] threads: 500, tps: 0.00, reads: 61941.79, writes: 17834.27, response time: 148.29ms (95%), errors: 0.00, reconnects:  0.00
[  54s] threads: 500, tps: 0.00, reads: 62918.54, writes: 17996.15, response time: 142.63ms (95%), errors: 0.00, reconnects:  0.00
[  57s] threads: 500, tps: 0.00, reads: 63686.00, writes: 18185.57, response time: 142.84ms (95%), errors: 0.00, reconnects:  0.00
[  60s] threads: 500, tps: 0.00, reads: 62141.97, writes: 17814.76, response time: 144.56ms (95%), errors: 0.00, reconnects:  0.00
OLTP test statistics:
    queries performed:
        read:                            3942036
        write:                           1126296
        other:                           0
        total:                           5068332
    transactions:                        0      (0.00 per sec.)
    read/write requests:                 5068332 (84390.38 per sec.)
    other operations:                    0      (0.00 per sec.)
    ignored errors:                      0      (0.00 per sec.)
    reconnects:                          0      (0.00 per sec.)
General statistics:
    total time:                          60.0582s
    total number of events:              281574
    total time taken by event execution: 30009.6912s
    response time:
         min:                                 29.21ms
         avg:                                106.58ms
         max:                                543.26ms
         approx.  95 percentile:             182.53ms
Threads fairness:
    events (avg/stddev):           563.1480/22.34
    execution time (avg/stddev):   60.0194/0.02
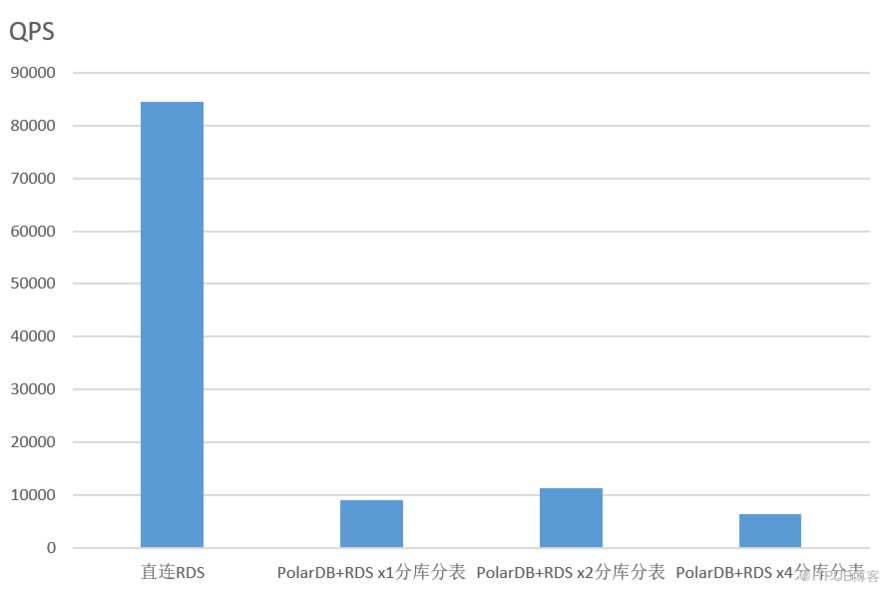
平均QPS为84390, 平均响应时间106ms。
测试二:
PolarDB-X+RDS x 1 分库分表,4张表,每个表1亿条记录。
/usr/local/bin/sysbench --test='/usr/local/share/sysbench/oltp.lua' --oltp_tables_count=4 --oltp-table-size=100000000  --mysql-user=sysbenchuser --mysql-password=sysbenchuser_123 --mysql-table-engine=innodb  --rand-init=on --report-interval=3 --mysql-host=drdsbggamlqgcm2o.drds.aliyuncs.com --mysql-port=3306 --mysql-db=polardb_test --max-time=60 --max-requests=0 --oltp_skip_trx=on --oltp_auto_inc=off --oltp_secondary --oltp_range_size=5 --mysql_table_options='dbpartition by hash(`id`) tbpartition by hash(`id`) tbpartitions 4' --num-threads=500 run
sysbench 0.5:  multi-threaded system evaluation benchmark
Running the test with following options:
Number of threads: 500
Report intermediate results every 3 second(s)
Initializing random number generator from timer.
Random number generator seed is 0 and will be ignored
Initializing worker threads...
Threads started!
[   3s] threads: 500, tps: 0.00, reads: 4735.25, writes: 983.57, response time: 1564.38ms (95%), errors: 0.00, reconnects:  0.00
[   6s] threads: 500, tps: 0.00, reads: 4737.01, writes: 1220.67, response time: 1905.52ms (95%), errors: 0.00, reconnects:  0.00
[   9s] threads: 500, tps: 0.00, reads: 4543.66, writes: 1315.00, response time: 1953.45ms (95%), errors: 0.00, reconnects:  0.00
[  12s] threads: 500, tps: 0.00, reads: 4498.66, writes: 1312.67, response time: 1868.24ms (95%), errors: 0.00, reconnects:  0.00
[  15s] threads: 500, tps: 0.00, reads: 6537.67, writes: 1870.67, response time: 1656.92ms (95%), errors: 0.00, reconnects:  0.00
[  18s] threads: 500, tps: 0.00, reads: 8285.67, writes: 2379.00, response time: 1272.83ms (95%), errors: 0.00, reconnects:  0.00
[  21s] threads: 500, tps: 0.00, reads: 8009.33, writes: 2281.33, response time: 1272.07ms (95%), errors: 0.00, reconnects:  0.00
[  24s] threads: 500, tps: 0.00, reads: 7869.67, writes: 2252.67, response time: 1366.82ms (95%), errors: 0.00, reconnects:  0.00
[  27s] threads: 500, tps: 0.00, reads: 7929.00, writes: 2264.33, response time: 1355.01ms (95%), errors: 0.00, reconnects:  0.00
[  30s] threads: 500, tps: 0.00, reads: 7790.00, writes: 2217.33, response time: 1343.70ms (95%), errors: 0.00, reconnects:  0.00
[  33s] threads: 500, tps: 0.00, reads: 7917.67, writes: 2251.00, response time: 1399.53ms (95%), errors: 0.00, reconnects:  0.00
[  36s] threads: 500, tps: 0.00, reads: 7877.67, writes: 2273.34, response time: 1406.25ms (95%), errors: 0.00, reconnects:  0.00
[  39s] threads: 500, tps: 0.00, reads: 7887.67, writes: 2237.33, response time: 1389.51ms (95%), errors: 0.00, reconnects:  0.00
[  42s] threads: 500, tps: 0.00, reads: 8036.34, writes: 2285.00, response time: 1362.73ms (95%), errors: 0.00, reconnects:  0.00
[  45s] threads: 500, tps: 0.00, reads: 7895.99, writes: 2246.66, response time: 1439.47ms (95%), errors: 0.00, reconnects:  0.00
[  48s] threads: 500, tps: 0.00, reads: 7465.67, writes: 2157.00, response time: 1426.60ms (95%), errors: 0.00, reconnects:  0.00
[  51s] threads: 500, tps: 0.00, reads: 7707.67, writes: 2222.67, response time: 1492.11ms (95%), errors: 0.00, reconnects:  0.00
[  54s] threads: 500, tps: 0.00, reads: 7812.33, writes: 2191.33, response time: 1359.48ms (95%), errors: 0.00, reconnects:  0.00
[  57s] threads: 500, tps: 0.00, reads: 7933.33, writes: 2286.00, response time: 1452.89ms (95%), errors: 0.00, reconnects:  0.00
[  60s] threads: 500, tps: 0.00, reads: 7967.00, writes: 2271.33, response time: 1394.51ms (95%), errors: 0.00, reconnects:  0.00
OLTP test statistics:
    queries performed:
        read:                            432236
        write:                           123496
        other:                           0
        total:                           555732
    transactions:                        0      (0.00 per sec.)
    read/write requests:                 555732 (9148.95 per sec.)
    other operations:                    0      (0.00 per sec.)
    ignored errors:                      0      (0.00 per sec.)
    reconnects:                          0      (0.00 per sec.)
General statistics:
    total time:                          60.7427s
    total number of events:              30874
    total time taken by event execution: 30197.3480s
    response time:
         min:                                225.35ms
         avg:                                978.08ms
         max:                               2641.96ms
         approx.  95 percentile:            1656.43ms
Threads fairness:
    events (avg/stddev):           61.7480/2.30
    execution time (avg/stddev):   60.3947/0.18
平均QPS为9148, 平均响应时间978ms。
测试三:
PolarDB-X+RDS x 2 分库分表,4张表,每个表1亿条记录。
/usr/local/bin/sysbench --test='/usr/local/share/sysbench/oltp.lua' --oltp_tables_count=4 --oltp-table-size=100000000  --mysql-user=sysbenchuser --mysql-password=sysbenchuser_123 --mysql-table-engine=innodb  --rand-init=on --report-interval=3 --mysql-host=drdsbggamlqgcm2o.drds.aliyuncs.com --mysql-port=3306 --mysql-db=polardb1 --max-time=30 --max-requests=0 --oltp_skip_trx=on --oltp_auto_inc=off --oltp_secondary --oltp_range_size=5 --mysql_table_options='dbpartition by hash(`id`) tbpartition by hash(`id`) tbpartitions 4' --num-threads=500 run
sysbench 0.5:  multi-threaded system evaluation benchmark
Running the test with following options:
Number of threads: 500
Report intermediate results every 3 second(s)
Initializing random number generator from timer.
Random number generator seed is 0 and will be ignored
Initializing worker threads...
Threads started!
[   3s] threads: 500, tps: 0.00, reads: 9888.48, writes: 2413.65, response time: 896.48ms (95%), errors: 0.00, reconnects:  0.00
[   6s] threads: 500, tps: 0.00, reads: 8386.68, writes: 2417.00, response time: 997.29ms (95%), errors: 0.00, reconnects:  0.00
[   9s] threads: 500, tps: 0.00, reads: 8718.34, writes: 2473.67, response time: 1086.75ms (95%), errors: 0.00, reconnects:  0.00
[  12s] threads: 500, tps: 0.00, reads: 9029.31, writes: 2506.66, response time: 949.51ms (95%), errors: 0.00, reconnects:  0.00
[  15s] threads: 500, tps: 0.00, reads: 8980.68, writes: 2639.67, response time: 1023.91ms (95%), errors: 0.00, reconnects:  0.00
[  18s] threads: 500, tps: 0.00, reads: 9095.68, writes: 2600.00, response time: 991.04ms (95%), errors: 0.00, reconnects:  0.00
[  21s] threads: 500, tps: 0.00, reads: 9023.98, writes: 2577.66, response time: 993.71ms (95%), errors: 0.00, reconnects:  0.00
[  24s] threads: 500, tps: 0.00, reads: 8729.67, writes: 2492.00, response time: 954.93ms (95%), errors: 0.00, reconnects:  0.00
[  27s] threads: 500, tps: 0.00, reads: 9045.01, writes: 2590.34, response time: 939.61ms (95%), errors: 0.00, reconnects:  0.00
[  30s] threads: 500, tps: 0.00, reads: 8361.00, writes: 2303.67, response time: 1002.37ms (95%), errors: 0.00, reconnects:  0.00
OLTP test statistics:
    queries performed:
        read:                            269010
        write:                           76860
        other:                           0
        total:                           345870
    transactions:                        0      (0.00 per sec.)
    read/write requests:                 345870 (11405.24 per sec.)
    other operations:                    0      (0.00 per sec.)
    ignored errors:                      0      (0.00 per sec.)
    reconnects:                          0      (0.00 per sec.)
General statistics:
    total time:                          30.3255s
    total number of events:              19215
    total time taken by event execution: 15071.3561s
    response time:
         min:                                229.94ms
         avg:                                784.35ms
         max:                               1345.68ms
         approx.  95 percentile:             997.88ms
Threads fairness:
    events (avg/stddev):           38.4300/1.32
    execution time (avg/stddev):   30.1427/0.09
平均QPS为11405, 平均响应时间784ms。
测试四:
PolarDB-X+RDS x 4 分库分表,4张表,每个表1亿条记录。
/usr/local/bin/sysbench --test='/usr/local/share/sysbench/oltp.lua' --oltp_tables_count=4 --oltp-table-size=100000000  --mysql-user=sysbenchuser --mysql-password=sysbenchuser_123 --mysql-table-engine=innodb  --rand-init=on --report-interval=3 --mysql-host=drdsbggamlqgcm2o.drds.aliyuncs.com --mysql-port=3306 --mysql-db=polardb2 --max-time=30 --max-requests=0 --oltp_skip_trx=on --oltp_auto_inc=off --oltp_secondary --oltp_range_size=5 --mysql_table_options='dbpartition by hash(`id`) tbpartition by hash(`id`) tbpartitions 4' --num-threads=500 run
sysbench 0.5:  multi-threaded system evaluation benchmark
Running the test with following options:
Number of threads: 500
Report intermediate results every 3 second(s)
Initializing random number generator from timer.
Random number generator seed is 0 and will be ignored
Initializing worker threads...
Threads started!
[   3s] threads: 500, tps: 0.00, reads: 6095.84, writes: 1317.49, response time: 1588.92ms (95%), errors: 0.00, reconnects:  0.00
[   6s] threads: 500, tps: 0.00, reads: 4787.67, writes: 1334.00, response time: 1661.89ms (95%), errors: 0.00, reconnects:  0.00
[   9s] threads: 500, tps: 0.00, reads: 4896.67, writes: 1428.00, response time: 1684.43ms (95%), errors: 0.00, reconnects:  0.00
[  12s] threads: 500, tps: 0.00, reads: 5322.68, writes: 1477.34, response time: 1649.01ms (95%), errors: 0.00, reconnects:  0.00
[  15s] threads: 500, tps: 0.00, reads: 4916.33, writes: 1413.33, response time: 1706.25ms (95%), errors: 0.00, reconnects:  0.00
[  18s] threads: 500, tps: 0.00, reads: 4951.66, writes: 1439.33, response time: 1639.16ms (95%), errors: 0.00, reconnects:  0.00
[  21s] threads: 500, tps: 0.00, reads: 5140.34, writes: 1461.67, response time: 1642.60ms (95%), errors: 0.00, reconnects:  0.00
[  24s] threads: 500, tps: 0.00, reads: 4989.66, writes: 1437.33, response time: 1583.70ms (95%), errors: 0.00, reconnects:  0.00
[  27s] threads: 500, tps: 0.00, reads: 5192.00, writes: 1474.67, response time: 1584.65ms (95%), errors: 0.00, reconnects:  0.00
[  30s] threads: 500, tps: 0.00, reads: 4864.00, writes: 1394.33, response time: 1698.60ms (95%), errors: 0.00, reconnects:  0.00
OLTP test statistics:
    queries performed:
        read:                            155512
        write:                           44432
        other:                           0
        total:                           199944
    transactions:                        0      (0.00 per sec.)
    read/write requests:                 199944 (6482.92 per sec.)
    other operations:                    0      (0.00 per sec.)
    ignored errors:                      0      (0.00 per sec.)
    reconnects:                          0      (0.00 per sec.)
General statistics:
    total time:                          30.8417s
    total number of events:              11108
    total time taken by event execution: 15274.5674s
    response time:
         min:                                832.14ms
         avg:                               1375.10ms
         max:                               2048.81ms
         approx.  95 percentile:            1645.55ms
Threads fairness:
    events (avg/stddev):           22.2160/0.80
    execution time (avg/stddev):   30.5491/0.24
平均QPS为6482, 平均响应时间1375ms
经过两轮测试,测试结果如下:
200个线程:
500个线程:
发现不管线程数是多少,PolarDB-x 1.0在OLTP场景下的吞吐量都比直连RDS低很多。
咨询了阿里云工程师得到答复: 原版的sysbench otlp 生成的range是bewteen a and a+n,这种 a+n 目前在drds是不分区裁剪,会全表扫描,阿里云版本oltp_drds.lua生成的between生成的range 是bewteen a and b, 这要就可以正常地分区裁剪。
问题是这样的吗?我们下篇文章接着测试。


 2965
2965


 被折叠的 条评论
为什么被折叠?
被折叠的 条评论
为什么被折叠?
 到【灌水乐园】发言


