


官网demo地址:
这篇和七、openlayers官网示例Band Contrast Stretch解析——加载地图并修改颜色差不多
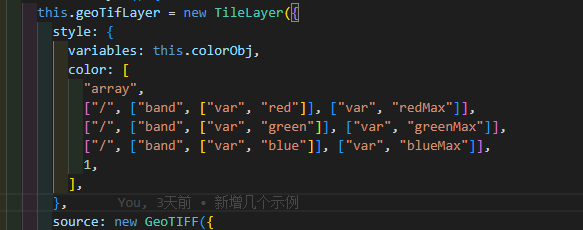
初始化地图之后添加了GeoTIFF数据源的WebGLTile图层。
this.geoTIFFLayer = new TileLayer({
style: this.stylesArr[this.styleSelector],
source: new GeoTIFF({
normalize: false,
sources: [
{
url: "https://s2downloads.eox.at/demo/EOxCloudless/2020/rgbnir/s2cloudless2020-16bits_sinlge-file_z0-4.tif",
},
],
}),
});
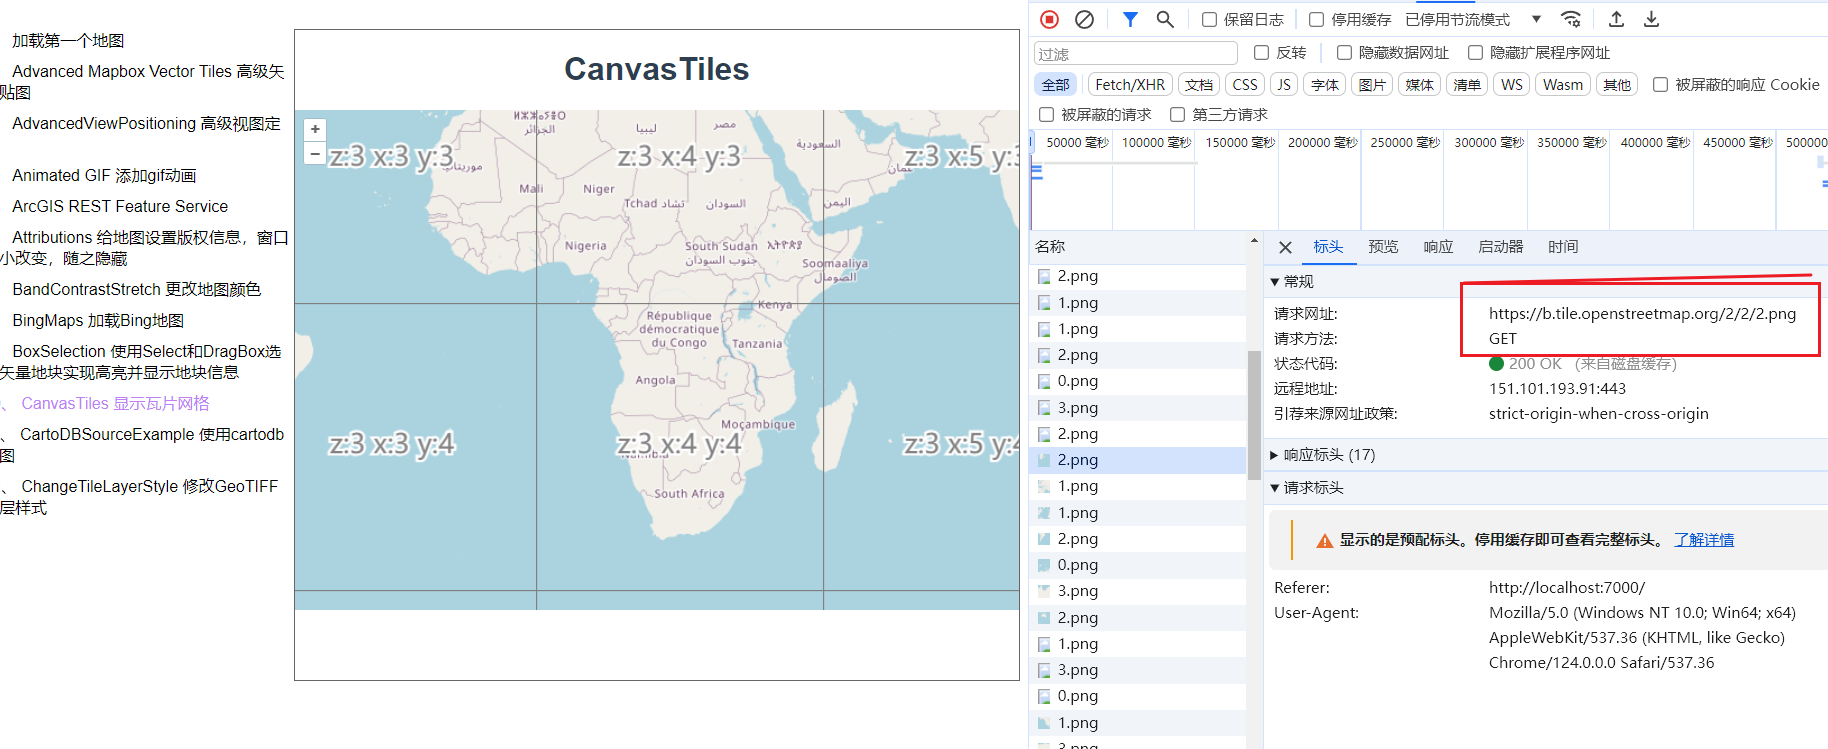
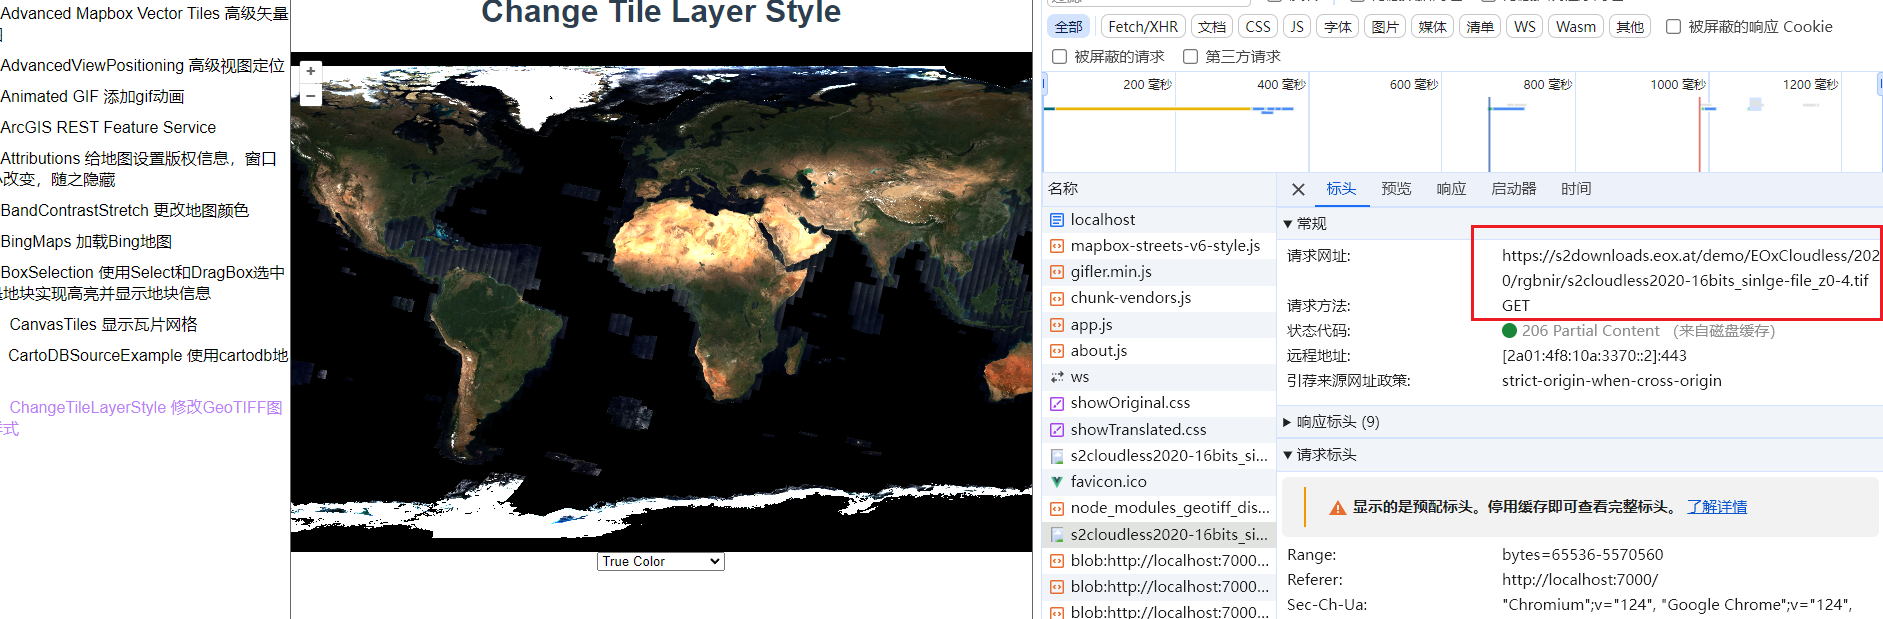
this.map.addLayer(this.geoTIFFLayer);WebGLTile 图层加载方式和之前我们加载的切片不同,XYZ请求的是png,WebGLTile 加载的是tif文件,我们可以看下网络请求。
这是xyz
这是WebGLTile
WebGLTile和Tile的区别是什么?
-
Tile(瓦片):
- Tile 是地图上的基本单元,通常是一个小的图像或数据块,用于在地图上构建图像。
- 传统的瓦片可以是静态的图像(如PNG或JPEG格式),也可以是包含地图数据的矢量格式(如GeoJSON格式)。
- 瓦片通常在地图上被平铺和加载,以构建出整个地图的图像或数据。
-
WebGLTile(WebGL 瓦片):
- WebGLTile 使用 WebGL(Web Graphics Library)技术来渲染瓦片,这是一种基于 JavaScript 的图形渲染 API,可以实现高性能的、交互式的 2D 和 3D 图形。
- WebGLTile 可以利用硬件加速图形渲染,从而在 Web 地图应用程序中实现更快的渲染和更流畅的交互体验。
- WebGLTile 通常用于渲染复杂的地图效果,如动态光照、阴影、3D 效果等,这些效果传统的瓦片渲染技术很难实现。
因此,WebGLTile 是一种基于 WebGL 技术的高性能瓦片渲染方法,它可以在 Web 地图应用程序中实现更快速、更流畅和更丰富的地图渲染效果。
示例中定义了一个stylesArr数组,里面装了几种不同的配色方案,通过下拉框选择对应的方案就可以实现地图上颜色的配置。我们来看最终生成的数组长什么样。
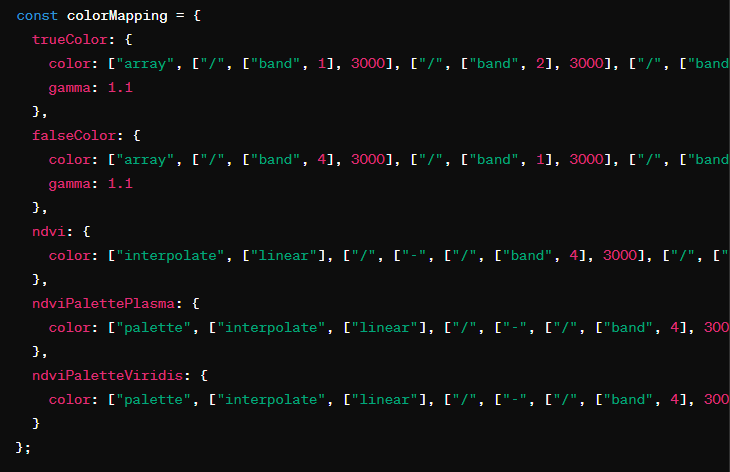
这种格式看着真的很奇怪,但是实际上这是一种特定的数据结构,通常用于表示复杂的颜色映射规则。这种格式可以被解析为一组指令,告诉地图或数据可视化工具如何根据数据值来选择颜色。
其中vdvi这个配置定义了归一化植被指数(NDVI)的颜色映射规则。NDVI 是一种用于表示植被覆盖程度的指标,其取值范围通常在 -1 到 1 之间。在这个配置中,NDVI 值被映射到一组颜色值,根据不同的 NDVI 值采用不同的颜色。相当于分段配色了,NDVI 值在-0.2~-0.1之间的颜色就是rgb = [191, 191, 191]。
const ndvi = {
        color: [
          "interpolate",
          ["linear"],
          ["/", ["-", nir, red], ["+", nir, red]],
          // color ramp for NDVI values, ranging from -1 to 1
          -0.2,
          [191, 191, 191],
          -0.1,
          [219, 219, 219],
          0,
          [255, 255, 224],
          0.025,
          [255, 250, 204],
          0.05,
          [237, 232, 181],
          0.075,
          [222, 217, 156],
          0.1,
          [204, 199, 130],
          0.125,
          [189, 184, 107],
          0.15,
          [176, 194, 97],
          0.175,
          [163, 204, 89],
          0.2,
          [145, 191, 82],
          0.25,
          [128, 179, 71],
          0.3,
          [112, 163, 64],
          0.35,
          [97, 150, 54],
          0.4,
          [79, 138, 46],
          0.45,
          [64, 125, 36],
          0.5,
          [48, 110, 28],
          0.55,
          [33, 97, 18],
          0.6,
          [15, 84, 10],
          0.65,
          [0, 69, 0],
        ],
      };
小细节:
这里传递的样式数组和之前修改地图颜色时传递的数组格式不太一样,那是因为之前的例子中更改的是整个地图的颜色比如调整“红”的值就是在改变整个图片中的红颜色。个人认为比较适用于根据UI设计调整底图颜色。而这次的颜色主要是根据数据的大小变的,比较适用于展示具体业务数据的分布情况,比如某区域植被长势、植被覆盖、气温、生物量等。
示例中下拉框的值改变后就可以用来切换地图的样式了,有一说一,这种切换颜色的方式真的太厉害啦,像我们之前,更改图层样式,前端需要重新请求一次geoserver,传递style字段,geoserver返回新的图片再绘制到地图上,不仅需要一次次请求,请求速度也比较慢。 而这种切换颜色时根本不用发请求。只是要把数据源处理成GeoTIFF格式再发布到geoserver需要废些心思。像我~完全不会。。。(⊙o⊙)…
 update() {
      const style = this.stylesArr[this.styleSelector];
      this.geoTIFFLayer.setStyle(style);
    },
完整代码
<template>
  <div class="box">
    <h1>Change Tile Layer Style</h1>
    <div id="map"></div>
    <select id="style" @change="update" v-model="styleSelector">
      <option value="trueColor">True Color</option>
      <option value="falseColor">False Color</option>
      <option value="ndvi">NDVI</option>
      <option value="ndviPalettePlasma">NDVI w/ palette 1</option>
      <option value="ndviPaletteViridis">NDVI w/ palette 2</option>
    </select>
  </div>
</template>

<script>
import GeoTIFF from "ol/source/GeoTIFF.js";
import Map from "ol/Map.js";
import TileLayer from "ol/layer/WebGLTile.js";
import View from "ol/View.js";
export default {
  name: "",
  components: {},
  data() {
    return {
      map: null,
      styleSelector: "trueColor",
      geoTIFFLayer: null,
      stylesArr: [],
      max:3000
    };
  },
  computed: {},
  created() {},
  mounted() {
    this.initMap()
    this.initStylesArr()
    this.initGeoTIFFLayer()
  },
  methods: {
    normalize(value) {
      return ["/", value, this.max];
    },
    update() {
      const style = this.stylesArr[this.styleSelector];
      this.geoTIFFLayer.setStyle(style);
    },
    initMap() {
      this.map = new Map({
        target: "map",
        layers: [],
        view: new View({
          projection: "EPSG:4326",
          center: [0, 0],
          zoom: 2,
          maxZoom: 6,
        }),
      });
    },
    initGeoTIFFLayer() {
      this.geoTIFFLayer = new TileLayer({
        style: this.stylesArr[this.styleSelector],
        source: new GeoTIFF({
          normalize: false,
          sources: [
            {
              url: "https://s2downloads.eox.at/demo/EOxCloudless/2020/rgbnir/s2cloudless2020-16bits_sinlge-file_z0-4.tif",
            },
          ],
        }),
      });
      this.map.addLayer(this.geoTIFFLayer);
    },
    initStylesArr() {
      const red = this.normalize(["band", 1]);
      const green = this.normalize(["band", 2]);
      const blue = this.normalize(["band", 3]);
      const nir = this.normalize(["band", 4]);

      const trueColor = {
        color: ["array", red, green, blue, 1],
        gamma: 1.1,
      };

      const falseColor = {
        color: ["array", nir, red, green, 1],
        gamma: 1.1,
      };

      const ndvi = {
        color: [
          "interpolate",
          ["linear"],
          ["/", ["-", nir, red], ["+", nir, red]],
          // color ramp for NDVI values, ranging from -1 to 1
          -0.2,
          [191, 191, 191],
          -0.1,
          [219, 219, 219],
          0,
          [255, 255, 224],
          0.025,
          [255, 250, 204],
          0.05,
          [237, 232, 181],
          0.075,
          [222, 217, 156],
          0.1,
          [204, 199, 130],
          0.125,
          [189, 184, 107],
          0.15,
          [176, 194, 97],
          0.175,
          [163, 204, 89],
          0.2,
          [145, 191, 82],
          0.25,
          [128, 179, 71],
          0.3,
          [112, 163, 64],
          0.35,
          [97, 150, 54],
          0.4,
          [79, 138, 46],
          0.45,
          [64, 125, 36],
          0.5,
          [48, 110, 28],
          0.55,
          [33, 97, 18],
          0.6,
          [15, 84, 10],
          0.65,
          [0, 69, 0],
        ],
      };

      const ndviPalettePlasma = {
        color: [
          "palette",
          [
            "interpolate",
            ["linear"],
            ["/", ["-", nir, red], ["+", nir, red]],
            -0.2,
            0,
            0.65,
            4,
          ],
          ["#0d0887", "#7e03a8", "#cb4778", "#f89540", "#f0f921"],
        ],
      };
      const ndviPaletteViridis = {
        color: [
          "palette",
          [
            "interpolate",
            ["linear"],
            ["/", ["-", nir, red], ["+", nir, red]],
            -0.2,
            0,
            0.65,
            4,
          ],
          ["#440154", "#3b528b", "#21918c", "#5ec962", "#fde725"],
        ],
      };

      this.stylesArr = {
        trueColor,
        falseColor,
        ndvi,
        ndviPalettePlasma,
        ndviPaletteViridis,
      };
    },
  },
};
</script>

<style lang="scss" scoped>
#map {
  width: 100%;
  height: 500px;
}
.box {
  height: 100%;
}
</style>


 8965
8965


 被折叠的 条评论
为什么被折叠?
被折叠的 条评论
为什么被折叠?
 到【灌水乐园】发言


