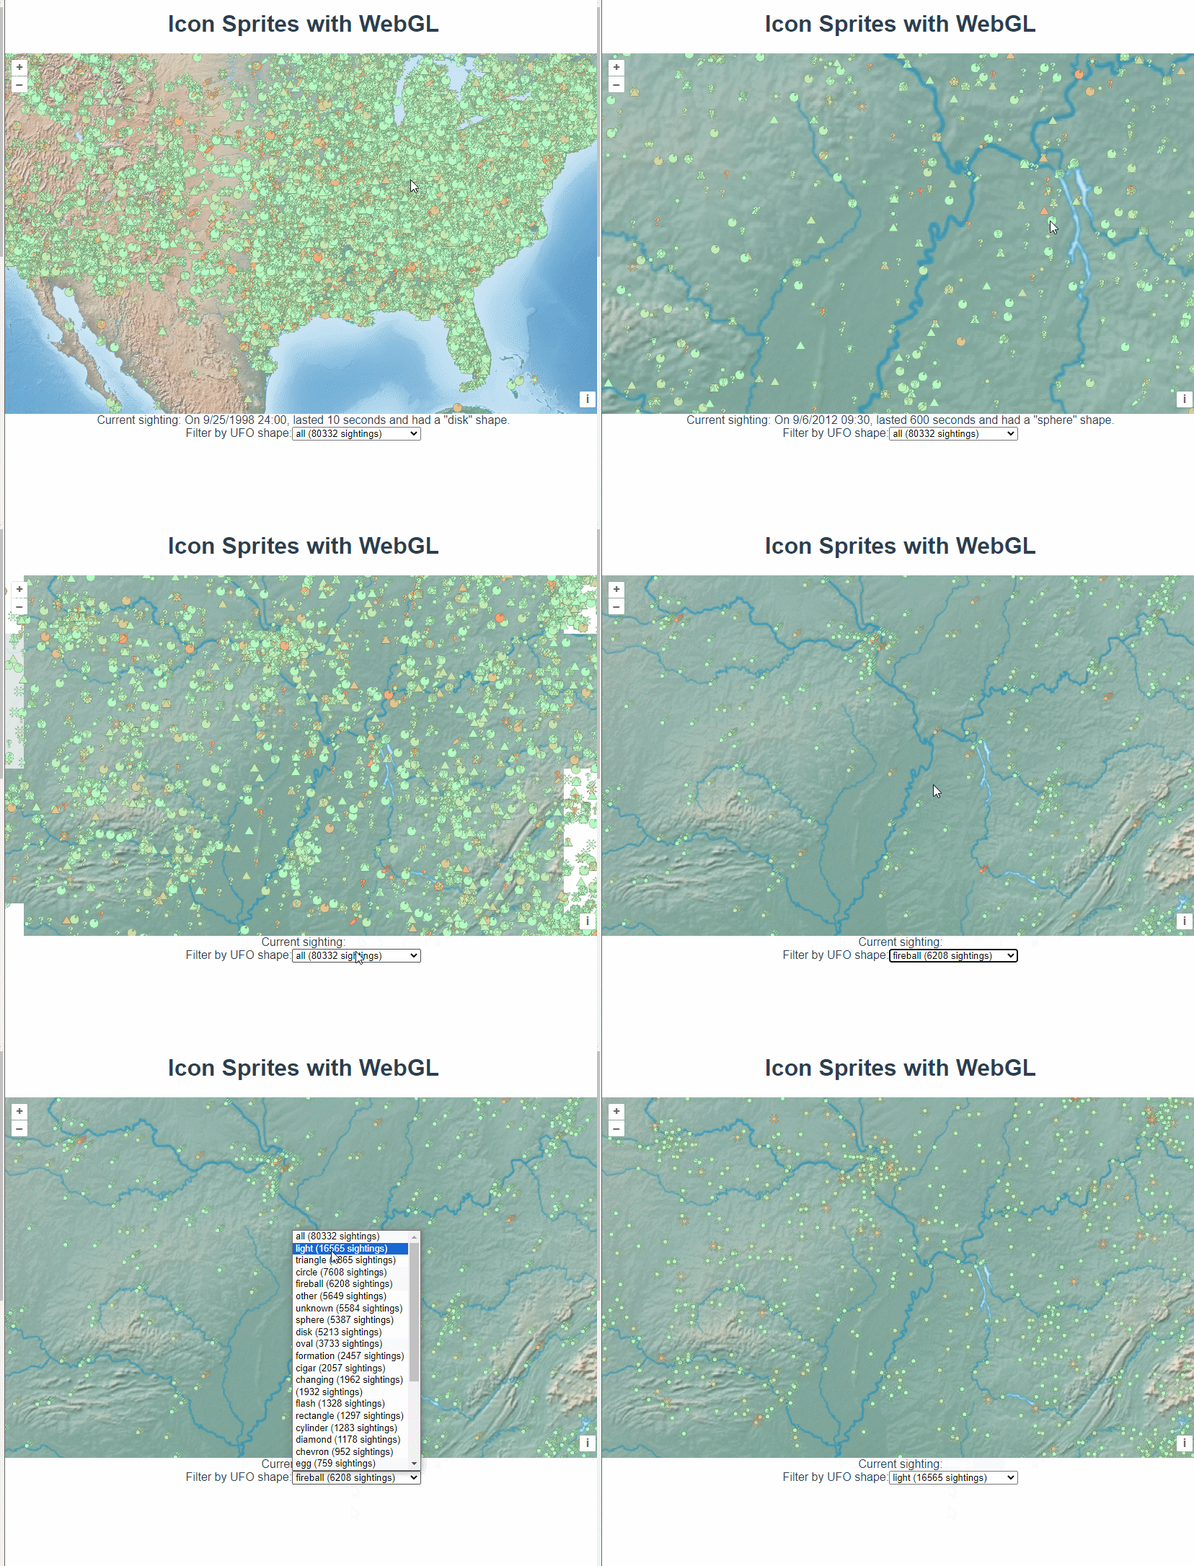
官网demo地址:
这篇讲的是使用webgl加载海量的数据点。
首先忘地图上添加了底图。
const rasterLayer = new Tile({
      source: new OGCMapTile({
        url: "https://maps.gnosis.earth/ogcapi/collections/NaturalEarth:raster:HYP_HR_SR_OB_DR/map/tiles/WebMercatorQuad",
        crossOrigin: "",
      }),
    });
    const map = new Map({
      layers: [rasterLayer],
      target: document.getElementById("map"),
      view: new View({
        center: [0, 4000000],
        zoom: 2,
      }),
    });
然后请求一个文件,获取点数据。
 const client = new XMLHttpRequest();
    client.open(
      "GET",
      "https://openlayers.org/en/latest/examples/data/csv/ufo_sighting_data.csv"
    );
    client.addEventListener("load", function () {
      const csv = client.responseText;

    });
    client.send();
请求回来的数据是这样的。

所以要对数据进行一些切割处理,最终生成feature
const shapeTypes = {};
      const features = [];

      let prevIndex = csv.indexOf("\n") + 1;
      let curIndex;
      while ((curIndex = csv.indexOf("\n", prevIndex)) !== -1) {
        const line = csv.substring(prevIndex, curIndex).split(",");
        prevIndex = curIndex + 1;

        const coords = [parseFloat(line[5]), parseFloat(line[4])];
        const shape = line[2];
        shapeTypes[shape] = (shapeTypes[shape] || 0) + 1;

        features.push(
          new Feature({
            datetime: line[0],
            year: parseInt(/[0-9]{4}/.exec(line[0])[0], 10),
            shape: shape,
            duration: line[3],
            geometry: new Point(fromLonLat(coords)),
          })
        );
      }
      shapeTypes["all"] = features.length;


 最低0.47元/天 解锁文章


 被折叠的 条评论
为什么被折叠?


