


官网demo地址:
这篇讲了如何在地图上添加缓冲图形
什么叫做缓冲几何?
几何缓冲(Geometric Buffering)是指在 GIS(地理信息系统)和计算几何中,围绕一个几何对象创建一个具有特定距离的区域。这种操作通常用于表示影响区域、保护区、可视范围等。例如,创建一个道路中心线的缓冲区,可以用于表示道路的影响范围。
缓冲几何的具体应用包括:
- 道路缓冲区:表示道路的影响范围,如交通噪音或安全距离。
- 河流缓冲区:用于表示河流两侧的生态保护区或防洪区。
- 设施缓冲区:用于表示设施(如学校、医院、加油站等)的服务范围或安全区。
首先,初始化地图
const rasterLayer = new TileLayer({
      source: new OSM(),
    });

    const map = new Map({
      layers: [rasterLayer, vectorLayer],
      target: document.getElementById("map"),
      view: new View({
        center: fromLonLat([126.979293, 37.528787]),
        zoom: 15,
      }),
    });
使用fetch请求json数据并创建一个矢量图层展示数据。
const source = new VectorSource();
fetch(
"https://openlayers.org/en/latest/examples/data/geojson/roads-seoul.geojson"
)
.then(function (response) {
return response.json();
})
.then(function (json) {
const format = new GeoJSON();
const features = format.readFeatures(json, {
featureProjection: "EPSG:3857",
})
source.addFeatures(features);
});
const vectorLayer = new VectorLayer({
source: source,
style: {
"fill-color": "rgba(255,255,255,0.5)",
"stroke-color": "#000",
"stroke-width": 2,
},
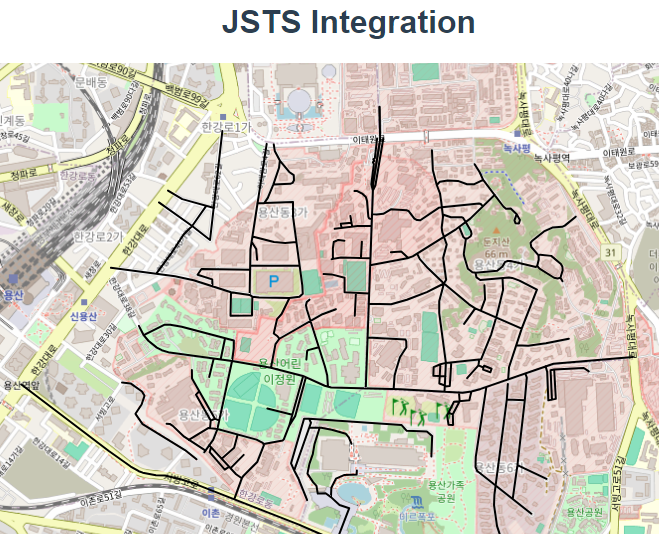
});先来看没有添加缓冲区的图层,是这样的:
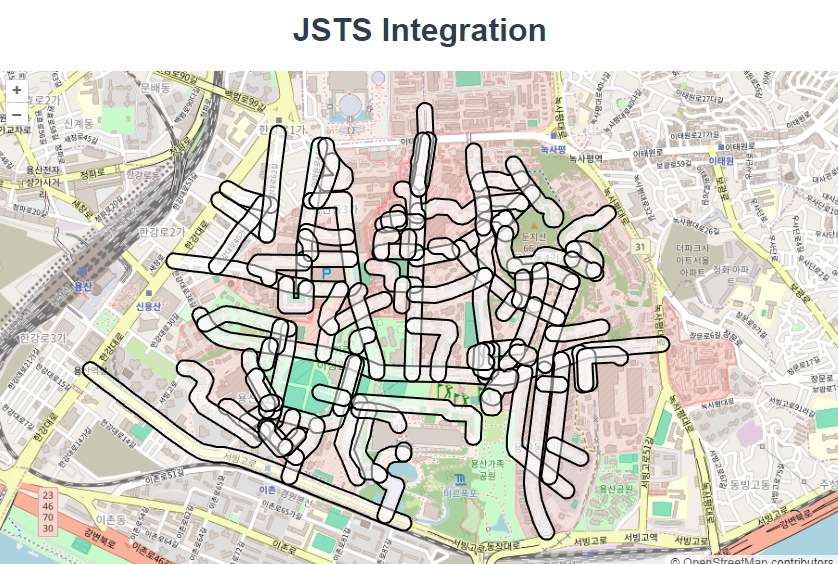
接下来添加缓冲区
先下载依赖
npm i jsts@2.3.0
import * as jsts from "jsts";
注入 OpenLayers 的几何类型到 JSTS 的解析器中
 const parser = new jsts.io.OL3Parser();
        parser.inject(
          Point,
          LineString,
          LinearRing,
          Polygon,
          MultiPoint,
          MultiLineString,
          MultiPolygon
        );
将每一个数据进行处理
for (let i = 0; i < features.length; i++) {
          const feature = features[i];
          // 将OpenLayers的几何形状转换为JSTS的几何形状
          const jstsGeom = parser.read(feature.getGeometry());

          //在每条线周围留出40米的缓冲区
          const buffered = jstsGeom.buffer(40);

          //从JSTS转换回来并替换特性上的几何图形
          feature.setGeometry(parser.write(buffered));
        }
完整代码:
<template>
  <div class="box">
    <h1>JSTS Integration</h1>
    <div id="map" class="map"></div>
  </div>
</template>

<script>
import GeoJSON from "ol/format/GeoJSON.js";
import LinearRing from "ol/geom/LinearRing.js";
import Map from "ol/Map.js";
import OSM from "ol/source/OSM.js";
import VectorSource from "ol/source/Vector.js";
import View from "ol/View.js";
import {
  LineString,
  MultiLineString,
  MultiPoint,
  MultiPolygon,
  Point,
  Polygon,
} from "ol/geom.js";
import { Tile as TileLayer, Vector as VectorLayer } from "ol/layer.js";
import { fromLonLat } from "ol/proj.js";
import * as jsts from "jsts";
export default {
  name: "",
  components: {},
  data() {
    return {
      map: null,
    };
  },
  computed: {},
  created() {},
  mounted() {
    const source = new VectorSource();
    fetch(
      "https://openlayers.org/en/latest/examples/data/geojson/roads-seoul.geojson"
    )
      .then(function (response) {
        return response.json();
      })
      .then(function (json) {
        const format = new GeoJSON();
        const features = format.readFeatures(json, {
          featureProjection: "EPSG:3857",
        });

        const parser = new jsts.io.OL3Parser();
        parser.inject(
          Point,
          LineString,
          LinearRing,
          Polygon,
          MultiPoint,
          MultiLineString,
          MultiPolygon
        );

        for (let i = 0; i < features.length; i++) {
          const feature = features[i];
          // 将OpenLayers的几何形状转换为JSTS的几何形状
          const jstsGeom = parser.read(feature.getGeometry());

          //在每条线周围留出40米的缓冲区
          const buffered = jstsGeom.buffer(40);

          //从JSTS转换回来并替换特性上的几何图形
          feature.setGeometry(parser.write(buffered));
        }

        source.addFeatures(features);
      });
    const vectorLayer = new VectorLayer({
      source: source,
      style: {
        "fill-color": "rgba(255,255,255,0.5)",
        "stroke-color": "#000",
        "stroke-width": 2,
      },
    });

    const rasterLayer = new TileLayer({
      source: new OSM(),
    });

    const map = new Map({
      layers: [rasterLayer, vectorLayer],
      target: document.getElementById("map"),
      view: new View({
        center: fromLonLat([126.979293, 37.528787]),
        zoom: 15,
      }),
    });
  },
  methods: {},
};
</script>

<style lang="scss" scoped>
#map {
  width: 100%;
  height: 500px;
}
.box {
  height: 100%;
}

</style>


 75
75

 被折叠的 条评论
为什么被折叠?
被折叠的 条评论
为什么被折叠?
 到【灌水乐园】发言


