


上期回顾:上期文章讲解了如何在地图上打点与连线,本章将讲述如何实现双击下钻与tip标签返回上级。
本期将使用到的素材有 chinaProvince.js 省级JSON 和 市级JSON 文件,JSON素材可以私聊我或者评论区百度云下载。
链接:https://pan.baidu.com/s/1EB3bv2JgvSlDDz2h5caDXw
提取码:9hj8
下钻其实就是JSON文件的替换与刷新,实现过程如下,完整代码在最底下,感谢支持!
第一步还是在data声明如下变量
  currentLevel: 0, //目前下钻层级
  endLevel: 2, //最深下钻层级
  nowDomainName: "china", //当前地图区域名
  history: [], //下钻历史记录
第二步为地图绑定双击事件
initMap(){
	  ······
      上述代码请见上章或者最底部
	  ······
	  const el = document.getElementById("china");
      this.chart = this.$echarts.init(el);
      // 注册双击事件
      this.chart.on("dblclick", (params) => {
        if (params.componentSubType == "map") {
          // 下钻事件进行下钻
          this.fnGoDown(params.name);
        }
      });
      this.chart.setOption(this.options);
}
    fnGoDown(name) {
      console.log("_fnGoDown_", name);
      //先判断可不可以下钻
      if (this.currentLevel >= this.endLevel) {
        return false;
      }
      const mapname = name == ("中国" || "china") ? "china" : name;
      this.nowDomainName = mapname;
      if (mapname == "china") {
        this.$echarts.registerMap(mapname, china);
        this.options.geo.map = mapname;
        this.options.series[0].map = mapname;
        this.chart.setOption(this.options);
      } else {
        // 下钻省
        if (this.currentLevel == 0) {
          // 寻找省id
          import("./mapJson/chinaProvince.json").then((provinceData) => {
            provinceData.features.forEach((element) => {
              if (element.properties.fullname === name) {
                // 获取省id
                const provinceId = element.properties.id;
                import(
                  "./mapJson/geometryProvince/" + provinceId + ".json"
                ).then((res) => {
                  // 清除打点与连线数据
                  this.options.series[1].data = [];
                  this.options.series[2].data = [];
                  //将options中数据替换掉,并刷新
                  const newMapJson = res.default;
                  this.options.geo.map = mapname;
                  this.options.series[0].map = mapname;
                  this.history.push(name);
                  this.currentLevel = 1;
                  this.nowGoDownData = res;
                  this.$echarts.registerMap(mapname, newMapJson);
                  this.chart.setOption(this.options);
                });
              }
            });
          });
        } else if (this.currentLevel == 1) {
          // 下钻市
          this.nowGoDownData.features.forEach((element) => {
            if (element.properties.name === mapname) {
              console.log("_element_", element, element.properties.id);
              import(
                "./mapJson/geometryCouties/" + element.properties.id + "00.json"
              ).then((res) => {
                // 清除打点与连线数据
                this.options.series[1].data = [];
                this.options.series[2].data = [];
                //将options中数据替换掉,并刷新
                const newMapJson = res.default;
                this.options.geo.map = mapname;
                this.options.series[0].map = mapname;
                this.history.push(name);
                this.currentLevel = 2;
                this.$echarts.registerMap(mapname, newMapJson);
                this.chart.setOption(this.options);
              });
            }
          });
        } else {
          console.log("__已经到最底层了!_");
        }
      }
    },
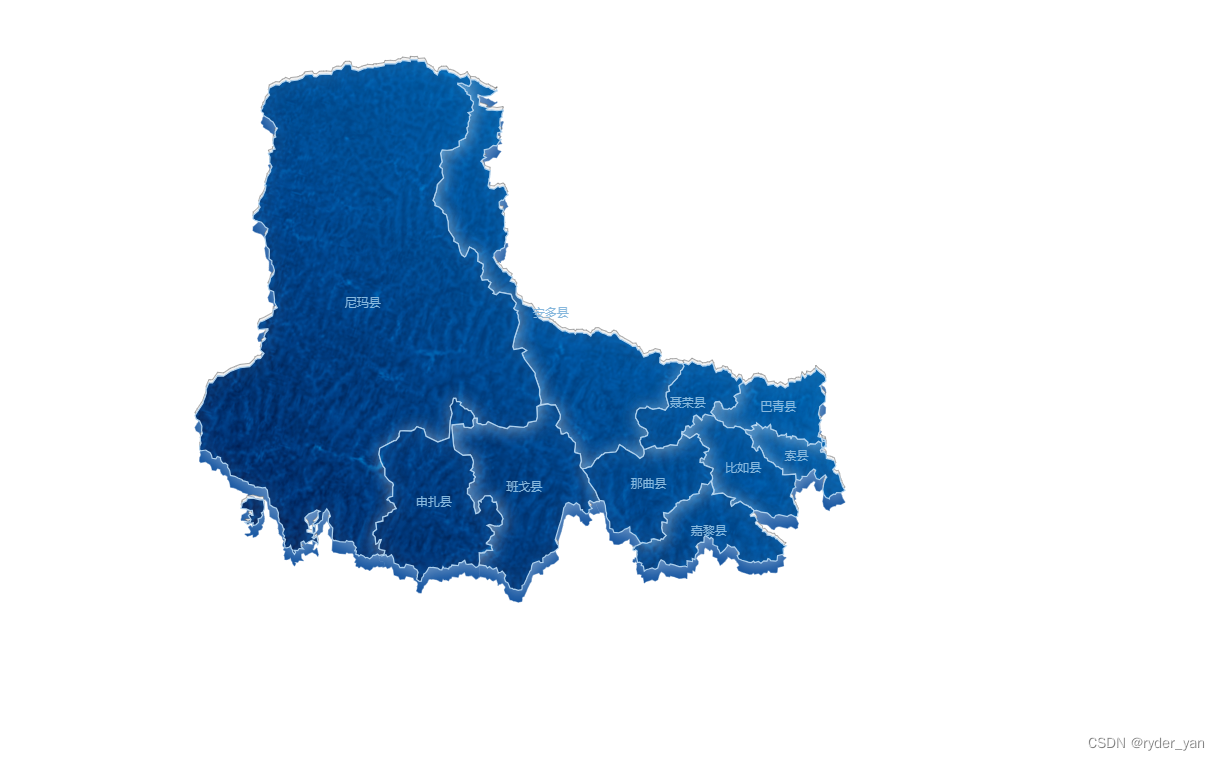
已经可以下钻到市了!
此时发现可以下钻但无法返回,所以需要在左上角增加一个下钻记录并点击能返回上级,同时为增加点样式,此处使用的是 less UI组件使用的是 iview
<template>
  <div class="mapContnet">
    <div class="tips">
      <Icon
        type="md-pin"
        color="#1FB9FF"
        size="18"
        style="padding-right: 4px;"
      />
      <div class="defaultTip" @click="fnMapTipReturn('china')">
        中华人民共和国
      </div>
      <div
        v-for="(item, index) in history"
        :key="`drill-${index}`"
        style="margin-left: 6px;"
        :class="index == history.length - 1 ? 'nowTip' : 'defaultTip'"
        @click="fnMapTipReturn(item)"
      >
        >
        {{ item }}
      </div>
    </div>
    <div id="china" style="width: 1300px;height: 650px;"></div>
  </div>
</template>
<style lang="less" scoped>
.mapContnet {
  overflow: hidden;
  width: 100%;
  height: 100%;
  background-color: #0f1733;
  overflow-y: auto;
  .tips {
    background: linear-gradient(to bottom right, #003c6f, #006aab);
    border: 1px solid #305a8c;
    border-radius: 4px;
    position: absolute;
    padding: 6px 10px;
    color: #7bb4e1;
    display: flex;
    align-items: center;
    left: 46px;
    font-size: 14px;
    z-index: 10;

    .nowTip {
      color: #c5ddec;
    }

    .defaultTip {
      cursor: pointer;
    }
  }
}
</style>
点击事件
fnMapTipReturn(name) {
  if (this.nowDomainName != name) {
    // 返回第二层
    this.currentLevel = 0;
    this.history = [];
    this.fnGoDown(name);
    if (name === "china") {
          // 返回获取大点数据,此处可以优化,把大点数据保存到状态机或者本地都可以
          this.fnGetUnitManagemeData();
        }
  }
},
此时就可以返回上层了!

完整代码如下
<template>
  <div class="mapContnet">
    <div class="tips">
      <Icon
        type="md-pin"
        color="#1FB9FF"
        size="18"
        style="padding-right: 4px;"
      />
      <div class="defaultTip" @click="fnMapTipReturn('china')">
        中华人民共和国
      </div>
      <div
        v-for="(item, index) in history"
        :key="`drill-${index}`"
        style="margin-left: 6px;"
        :class="index == history.length - 1 ? 'nowTip' : 'defaultTip'"
        @click="fnMapTipReturn(item)"
      >
        >
        {{ item }}
      </div>
    </div>
    <div id="china" style="width: 1300px;height: 650px;"></div>
  </div>
</template>

<script>
import china from "./mapJson/china.json";
import * as echarts from "echarts";
export default {
  data() {
    return {
      chart: null,
      options: null,
      unitManagementData: [], //大点数据
      mapLineDataArr: [], //连线数据
      currentLevel: 0, //目前下钻层级
      endLevel: 2, //最深下钻层级
      nowDomainName: "china", //当前地图区域名
      history: [], //下钻历史记录
      nowGoDownData: {}, //当前下钻信息
    };
  },
  methods: {
    initMap() {
      echarts.registerMap("china", china);
      // 加载纹理图片
      let mapTexture = document.createElement("img");
      mapTexture.src = require("./image/chinese_map_texture.png");
      this.options = {
        tooltip: {
          show: false,
        },
        //叠加阴影层
        geo: {
          map: "china",
          aspectScale: 0.8,
          layoutCenter: ["40%", "49.5%"],
          layoutSize: "100%",
          label: {
            emphasis: {
              show: false,
            },
          },
          itemStyle: {
            shadowColor: "#1253A0",
            shadowOffsetX: 0,
            shadowOffsetY: 15,
          },
          emphasis: {
            areaColor: "#101B3B",
          },
          regions: [
            {
              name: "南海诸岛",
              itemStyle: {
                areaColor: "#101B3B",
                borderColor: "#101B3B",
                opacity: 0,
                label: {
                  show: false,
                  color: "#009cc9",
                },
              },
              label: {
                show: false,
                color: "#FFFFFF",
                fontSize: 12,
              },
            },
          ],
        },
        series: [
          {
            type: "map",
            selectedMode: "single",
            map: "china",
            aspectScale: 0.8,
            layoutCenter: ["40%", "50%"], //地图位置
            layoutSize: "100%",
            zoom: 1, //当前视角的缩放比例
            label: {
              show: true,
              color: "#87B8DD",
              fontSize: 12,
            },

            itemStyle: {
              // 渲染背景图片
              areaColor: {
                image: mapTexture,
                repeat: "repeat",
              },
              borderColor: "#ADD0ED",
              borderWidth: 1.2,
              shadowColor: "rgba(255, 255, 255, 0.4)", // 设置阴影颜色,带有透明度
              shadowBlur: 15, // 设置阴影的模糊大小
              shadowOffsetX: 2, // 设置阴影在 X 轴方向上的偏移
              shadowOffsetY: 2, // 设置阴影在 Y 轴方向上的偏移
            },
            emphasis: {
              //区域
              areaColor: "#ffeb3b", // 高亮时的颜色
              itemStyle: {
                areaColor: "#1785BF",
              },
              label: {
                show: true,
                color: "#fff",
              },
            },
          },
          {
            name: "单位",
            type: "effectScatter",
            coordinateSystem: "geo",
            data: this.unitManagementData,
            symbolSize: function(val) {
              return 10;
            },
            showEffectOn: "render",
            rippleEffect: {
              brushType: "stroke",
            },
            label: {
              show: false,
              color: "#000",
              formatter(value) {
                return "";
              },
            },
            hoverAnimation: true,
            itemStyle: {
              normal: {
                color: "#4DEFFF",
                shadowBlur: 10,
                shadowColor: "#4DEFFF",
              },
            },
            zlevel: 1,
          },
          {
            name: "lines",
            type: "lines",
            coordinateSystem: "geo",
            zlevel: 2,
            large: true,
            effect: {
              show: true, // 开启动态线条效果
              constantSpeed: 30, // 线条速度
              symbol: "pin", // 标记的图形,支持图片和文字
              symbolSize: 10, // 标记的大小
              trailLength: 0, // 动态线条的长度
              loop: true, // 是否循环动画效果
            },
            lineStyle: {
              normal: {
                color: function(params) {
                  // 根据 status 属性判断连线颜色
                  return params.data.status === 0 ? "#CE373F" : "#4DEFFF";
                },
                width: 2,
                opacity: 0.4,
                curveness: 0.2, // 曲线程度
              },
              emphasis: {
                opacity: 0.8,
                width: 5,
              },
            },
            data: this.mapLineDataArr,
          },
        ],
      };

      const el = document.getElementById("china");
      this.chart = this.$echarts.init(el);
      // 注册点击事件
      this.chart.on("dblclick", (params) => {
        if (params.componentSubType == "map") {
          // 下钻事件进行下钻
          this.fnGoDown(params.name);
        }
      });
      this.chart.setOption(this.options);
    },
    fnGetUnitManagemeData() {
      import("./mapJson/china.json").then((econom) => {
        econom.features.forEach((element1) => {
          if (element1.properties.centroid) {
            this.unitManagementData.push({
              Name: element1.properties.name,
              value: element1.properties.centroid,
            });
            this.mapLineDataArr.push({
              name: `line`,
              fromName: `childPoint`,
              toName: `mainpoint`,
              coords: [element1.properties.centroid, [116.40717, 39.90469]],
              status: 1,
            });
          }
        });
        this.chart.setOption(this.options);
      });
    },
    fnGoDown(name) {
      console.log("_fnGoDown_", name);
      //先判断可不可以下钻
      if (this.currentLevel >= this.endLevel) {
        return false;
      }
      const mapname = name == ("中国" || "china") ? "china" : name;
      this.nowDomainName = mapname;
      if (mapname == "china") {
        this.$echarts.registerMap(mapname, china);
        this.options.geo.map = mapname;
        this.options.series[0].map = mapname;
        this.chart.setOption(this.options);
      } else {
        // 下钻省
        if (this.currentLevel == 0) {
          // 寻找省id
          import("./mapJson/chinaProvince.json").then((provinceData) => {
            provinceData.features.forEach((element) => {
              if (element.properties.fullname === name) {
                // 获取省id
                const provinceId = element.properties.id;
                import(
                  "./mapJson/geometryProvince/" + provinceId + ".json"
                ).then((res) => {
                  // 清除打点与连线数据
                  this.options.series[1].data = [];
                  this.options.series[2].data = [];
                  //将options中数据替换掉,并刷新
                  const newMapJson = res.default;
                  this.options.geo.map = mapname;
                  this.options.series[0].map = mapname;
                  this.history.push(name);
                  this.currentLevel = 1;
                  this.nowGoDownData = res;
                  this.$echarts.registerMap(mapname, newMapJson);
                  this.chart.setOption(this.options);
                });
              }
            });
          });
        } else if (this.currentLevel == 1) {
          // 下钻市
          this.nowGoDownData.features.forEach((element) => {
            if (element.properties.name === mapname) {
              console.log("_element_", element, element.properties.id);
              import(
                "./mapJson/geometryCouties/" + element.properties.id + "00.json"
              ).then((res) => {
                // 清除打点与连线数据
                this.options.series[1].data = [];
                this.options.series[2].data = [];
                //将options中数据替换掉,并刷新
                const newMapJson = res.default;
                this.options.geo.map = mapname;
                this.options.series[0].map = mapname;
                this.history.push(name);
                this.currentLevel = 2;
                this.$echarts.registerMap(mapname, newMapJson);
                this.chart.setOption(this.options);
              });
            }
          });
        } else {
          console.log("__已经到最底层了!_");
        }
      }
    },
    fnMapTipReturn(name) {
      if (this.nowDomainName != name) {
        // 返回第二层
        this.currentLevel = 0;
        this.history = [];
        this.fnGoDown(name);
        if (name === "china") {
          // 返回获取大点数据,此处可以优化,把大点数据保存到状态机或者本地都可以
          this.fnGetUnitManagemeData();
        }
      }
    },
  },
  mounted() {
    this.initMap();
    this.fnGetUnitManagemeData();
  },
};
</script>
<style lang="less" scoped>
.mapContnet {
  overflow: hidden;
  width: 100%;
  height: 100%;
  background-color: #0f1733;
  overflow-y: auto;
  .tips {
    background: linear-gradient(to bottom right, #003c6f, #006aab);
    border: 1px solid #305a8c;
    border-radius: 4px;
    position: absolute;
    padding: 6px 10px;
    color: #7bb4e1;
    display: flex;
    align-items: center;
    left: 46px;
    font-size: 14px;
    z-index: 10;

    .nowTip {
      color: #c5ddec;
    }

    .defaultTip {
      cursor: pointer;
    }
  }
}
</style>


 1万+
1万+


 被折叠的 条评论
为什么被折叠?
被折叠的 条评论
为什么被折叠?
 到【灌水乐园】发言


