


from sklearn.ensemble import RandomForestClassifier
import pandas as pd
import matplotlib.pyplot as plt
from sklearn.model_selection import train_test_split, cross_val_score, GridSearchCV, KFold
from imblearn.over_sampling import SMOTE
import xgboost as xgb
from sklearn.metrics import accuracy_score, confusion_matrix
from lightgbm import LGBMClassifier
from catboost import CatBoostClassifier
from sklearn.metrics import mean_squared_error
# 解决画图中文字体显示的问题
plt.rcParams['font.sans-serif'] = ['SimSun', 'Times New Roman'] # 汉字字体集
plt.rcParams['font.size'] = 10 # 字体大小
plt.rcParams['axes.unicode_minus'] = False
# 读取csv文件
df = pd.read_csv('C:/Users/.......csv')
# print(df.head()) # 打印前五行数据
# print(df['Accident_Level'].value_counts()) 返回事故等级列的值分布情况/频次
feature_list = ["WorkingDay", "Weather", "At_Night", "Plane_Alignment", "Curve_Length", "Radius", "Angle", "Slope", "Slope_Length", "Traffic_Volume", "Truck_Ratio"]
# 设置自变量和因变量
x = df.drop('Accident_Level', axis=1) # df中删掉某一列,扔掉列axis=1
y = df['Accident_Level']
# 过采样,采用SMOTE
oversampler = SMOTE(random_state=0)
os_x, os_y = oversampler.fit_resample(x, y)
# 拆分训练集和测试集
X_train, X_test, y_train, y_test = train_test_split(os_x, os_y, test_size=0.3, random_state=42)
# XGBoost
xgb_model = xgb.XGBClassifier(n_estimators=100, max_depth=5, learning_rate=0.1, random_state=42)
xgb_model.fit(X_train, y_train)
xgb_pred = xgb_model.predict(X_test)
xgb_rmse = mean_squared_error(y_test, xgb_pred, squared=False)
# LightGBM
lgb_model = LGBMClassifier(n_estimators=100, max_depth=5, learning_rate=0.1, random_state=42)
lgb_model.fit(X_train, y_train)
lgb_pred = lgb_model.predict(X_test)
lgb_rmse = mean_squared_error(y_test, lgb_pred, squared=False)
# CatBoost
cat_model = CatBoostClassifier(n_estimators=100, max_depth=5, learning_rate=0.1, random_seed=42, silent=True)
cat_model.fit(X_train, y_train)
cat_pred = cat_model.predict(X_test)
cat_rmse = mean_squared_error(y_test, cat_pred, squared=False)
# RandomForest
rfc_model = RandomForestClassifier()
seed = 5
rfc_model.fit(X_train, y_train)
rfc_pred = rfc_model.predict(X_test)
rfc_rmse = mean_squared_error(y_test, rfc_pred, squared=False)
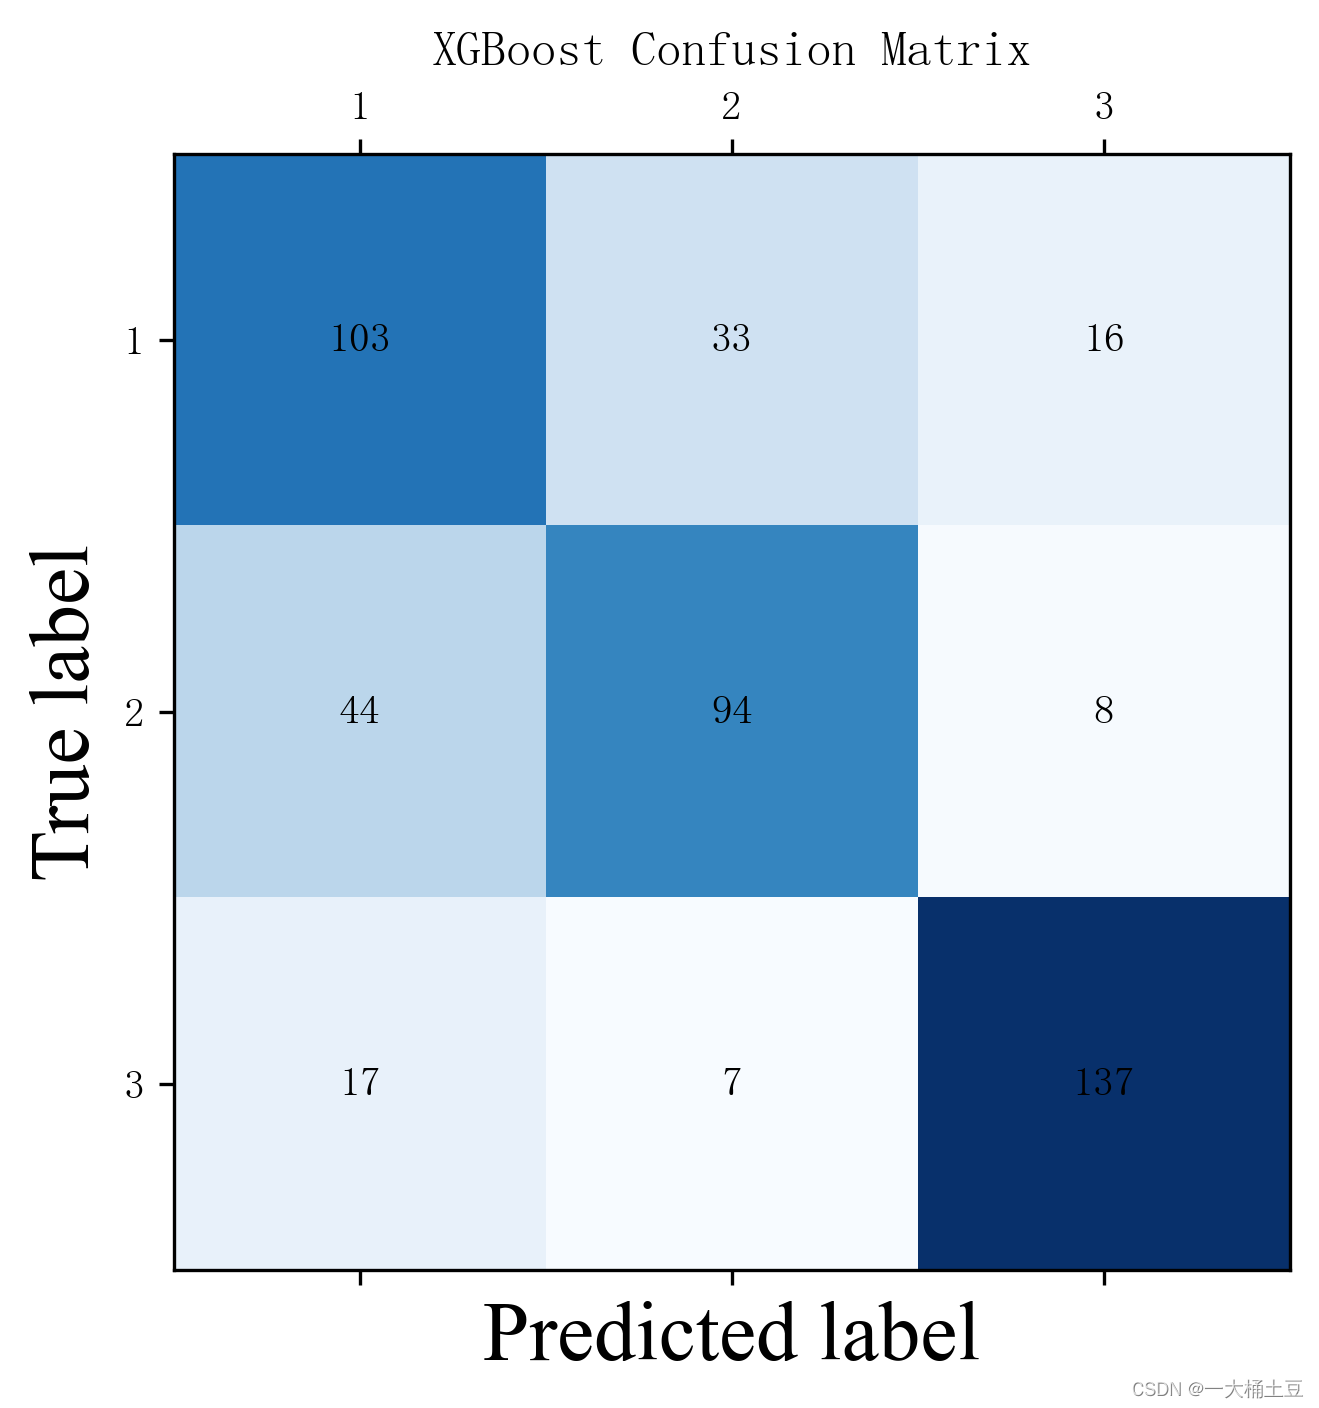
# XGBoost Confusion Matrix
C = confusion_matrix(y_test.tolist(), xgb_pred.tolist(), labels=[0, 1, 2]) # label与结果分类相对应
print(len(C))
plt.matshow(C, cmap=plt.cm.Blues) # 根据最下面的图按自己需求更改颜色
for i in range(len(C)):
for j in range(len(C)):
plt.annotate(C[j, i], xy=(i, j), horizontalalignment='center', verticalalignment='center')
plt.ylabel('True label')
plt.xlabel('Predicted label')
plt.ylabel('True label', fontdict={'family': 'Times New Roman', 'size': 20}) # 设置字体大小。
plt.xlabel('Predicted label', fontdict={'family': 'Times New Roman', 'size': 20})
plt.xticks(range(0, 3), labels=['1', '2', '3']) # 将x轴或y轴坐标,刻度 替换为文字/字符
plt.yticks(range(0, 3), labels=['1', '2', '3'])
plt.title("XGBoost Confusion Matrix")
plt.savefig("XGBoost Confusion Matrix", dpi=300, bbox_inches='tight')
plt.show()
# LightGBM Confusion Matrix
C = confusion_matrix(y_test.tolist(), lgb_pred.tolist(), labels=[0, 1, 2]) # label与结果分类相对应
print(len(C))
plt.matshow(C, cmap=plt.cm.Blues) # 根据最下面的图按自己需求更改颜色
for i in range(len(C)):
for j in range(len(C)):
plt.annotate(C[j, i], xy=(i, j), horizontalalignment='center', verticalalignment='center')
plt.ylabel('True label')
plt.xlabel('Predicted label')
plt.ylabel('True label', fontdict={'family': 'Times New Roman', 'size': 20}) # 设置字体大小。
plt.xlabel('Predicted label', fontdict={'family': 'Times New Roman', 'size': 20})
plt.xticks(range(0, 3), labels=['1', '2', '3']) # 将x轴或y轴坐标,刻度 替换为文字/字符
plt.yticks(range(0, 3), labels=['1', '2', '3'])
plt.title("LightGBM Confusion Matrix")
plt.savefig("LightGBM Confusion Matrix", dpi=300, bbox_inches='tight')
plt.show()
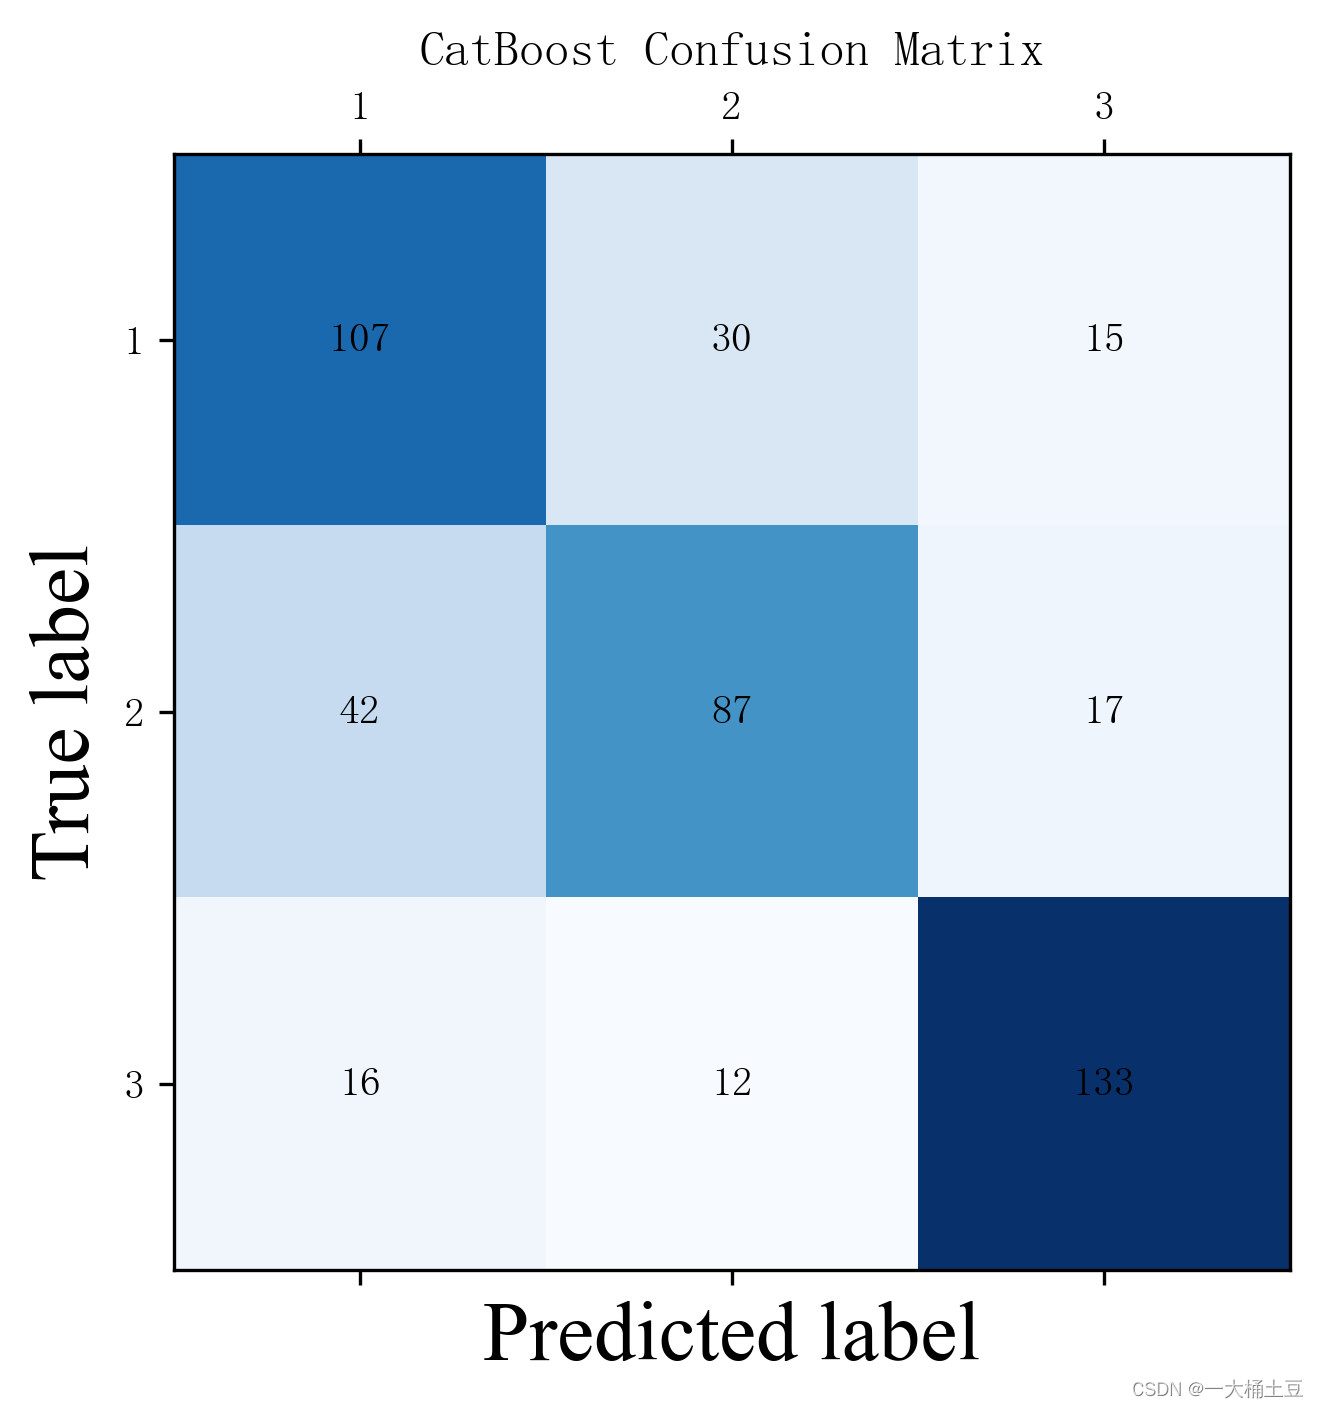
# CatBoost Confusion Matrix
C = confusion_matrix(y_test.tolist(), cat_pred.tolist(), labels=[0, 1, 2]) # label与结果分类相对应
print(len(C))
plt.matshow(C, cmap=plt.cm.Blues) # 根据最下面的图按自己需求更改颜色
for i in range(len(C)):
for j in range(len(C)):
plt.annotate(C[j, i], xy=(i, j), horizontalalignment='center', verticalalignment='center')
plt.ylabel('True label')
plt.xlabel('Predicted label')
plt.ylabel('True label', fontdict={'family': 'Times New Roman', 'size': 20}) # 设置字体大小。
plt.xlabel('Predicted label', fontdict={'family': 'Times New Roman', 'size': 20})
plt.xticks(range(0, 3), labels=['1', '2', '3']) # 将x轴或y轴坐标,刻度 替换为文字/字符
plt.yticks(range(0, 3), labels=['1', '2', '3'])
plt.title("CatBoost Confusion Matrix")
plt.savefig("CatBoost Confusion Matrix", dpi=300, bbox_inches='tight')
plt.show()
# RandomForest Confusion Matrix
C = confusion_matrix(y_test.tolist(), rfc_pred.tolist(), labels=[0, 1, 2]) # label与结果分类相对应
print(len(C))
plt.matshow(C, cmap=plt.cm.Blues) # 根据最下面的图按自己需求更改颜色
for i in range(len(C)):
for j in range(len(C)):
plt.annotate(C[j, i], xy=(i, j), horizontalalignment='center', verticalalignment='center')
plt.ylabel('True label')
plt.xlabel('Predicted label')
plt.ylabel('True label', fontdict={'family': 'Times New Roman', 'size': 20}) # 设置字体大小。
plt.xlabel('Predicted label', fontdict={'family': 'Times New Roman', 'size': 20})
plt.xticks(range(0, 3), labels=['1', '2', '3']) # 将x轴或y轴坐标,刻度 替换为文字/字符
plt.yticks(range(0, 3), labels=['1', '2', '3'])
plt.title("RandomForest Confusion Matrix")
plt.savefig("RandomForest Confusion Matrix", dpi=300, bbox_inches='tight')
plt.show()
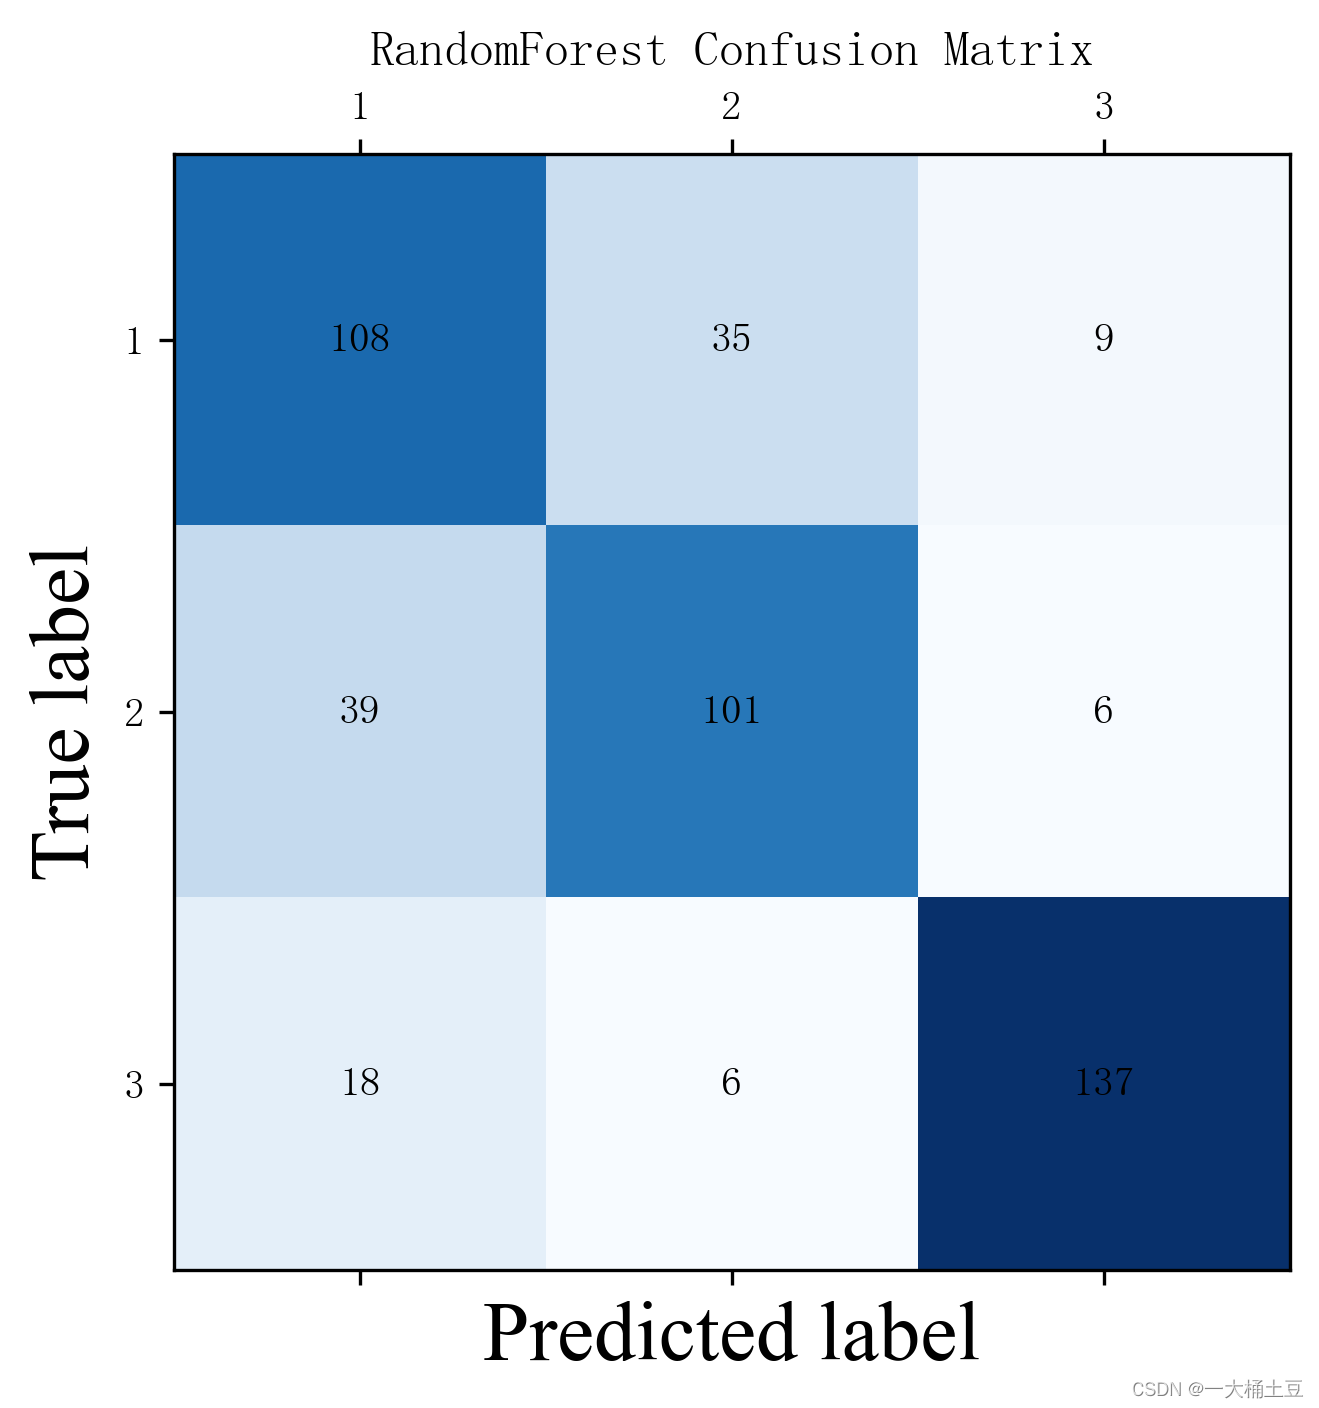

可以看到随机森林分类器的准确率最高。


 2452
2452

 被折叠的 条评论
为什么被折叠?
被折叠的 条评论
为什么被折叠?
 到【灌水乐园】发言


