


 本文介绍了使用Python进行网络数据采集,从招聘网站抓取大数据岗位信息并存储为CSV文件。接着,对数据进行预处理,处理薪资单位和缺失值。在数据可视化部分,展示了薪资分布的直方图和按地点分组的箱型图,以及学历占比的饼图,为大数据专业的应届生提供就业参考。
1数据采集
#数据采集
from lxml import etree
import requests
import csv

URI = "https://sou.zhaopin.com/?jl=801&kw=大数据&p={}"
headers = {
    "User-Agent":"Mozilla/5.0 (Windows NT 10.0; Win64; x64) AppleWebKit/537.36 (KHTML, like Gecko)"
}


def get_url(url):
    response = requests.get(url=url,headers=headers)
    html = response.content.decode("utf-8")
    return html

def get_data(html):
    etree_obj = etree.HTML(html)
    all_job = etree_obj.xpath('//div[@class="joblist-box__item clearfix"]')
    job_list = []
    for job in all_job:
        job_dic = {}
        job_name = job.xpath('./a/div[1]/div[1]/span[1]/span/text()')
        job_salary = job.xpath('normalize-space(./a/div[2]/div[1]/p/text())')
        job_area = job.xpath('./a/div[2]/div[1]/ul/li[1]/text()')[0]
        job_experience = job.xpath('./a/div[2]/div[1]/ul/li[2]/text()')[0]
        job_education = job.xpath('./a/div[2]/div[1]/ul/li[3]/text()')[0]


        job_skill = job.xpath('./a/div[3]/div[1]//div[@class="iteminfo__line3__welfare__item"]/text()')
        print(job_skill)
        job_dic['技能'] = job_skill


        if len(job_name) != 0:
            job_dic['岗位名称'] = job_name[0]
        job_dic['薪资'] = job_salary
        job_dic['地点'] = job_area
        job_dic['经验'] = job_experience
        job_dic['学历'] = job_education

        job_list.append(job_dic)
    return job_list

def save_data(job_list):
    with open('./大数据岗位招聘信息.csv', 'w', encoding="gb18030",newline="") as file:
        write = csv.DictWriter(file, fieldnames=['岗位名称', '薪资', '地点', '经验', '学历', '技能'])
        write.writeheader()
        for i in job_list:
            write.writerow(i)


if __name__ == "__main__":
    job_list = []
    for i in range(520):
        url = URI.format(i)
        print("正在解析第{}页中".format(i))
        html = get_url(URI)
        job_list1 = get_data(html)
        job_list+=job_list1
    save_data(job_list)
2数据预处理
import numpy as np
np.any(pd.isnull(df))
#检查是否有缺失值
df.isnull().sum()
#查看缺失值
def bottom_top(x,num=0):
if len(x.split('-')) >1:
x = x.split('-')[num]
if x.find('千') != -1:
x=float(x[0:x.find('千')])
elif x.find('万') != -1:
x=float(x[0:x.find('万')])*10
return x
df['最低薪资'] = df.薪资.apply(lambda x : bottom_top(x,0))
df['最高薪资'] = df.薪资.apply(lambda x : bottom_top(x,1))
#统一薪资单位为千/月import numpy as np
np.any(pd.isnull(df))
#再次查看是否有缺失值
df.isnull().sum()
#检查缺失值
#岗位名称 0
#薪资 0
#地点 0
#经验 0
#学历 0
#技能 0
#最低薪资 763
#最高薪资 763
dtype: int64
re=df.fillna(15,inplace=True)
print(re)
#替换缺失值为众数153数据可视化
import matplotlib.pyplot as plt
%matplotlib inline
plt.style.use('ggplot')
df.平均薪资.hist(bins=15)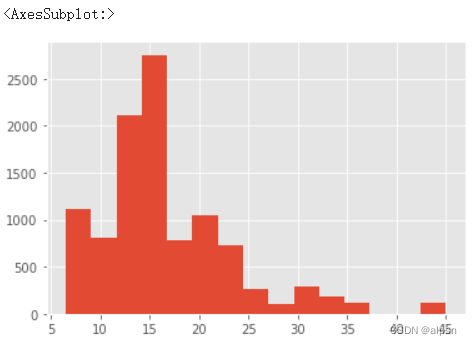
from matplotlib.font_manager import FontProperties
plt.rcParams['font.sans-serif']='SimHei'
ax=df.boxplot(column='平均薪资',by='地点',figsize=(12,7))
plt.show()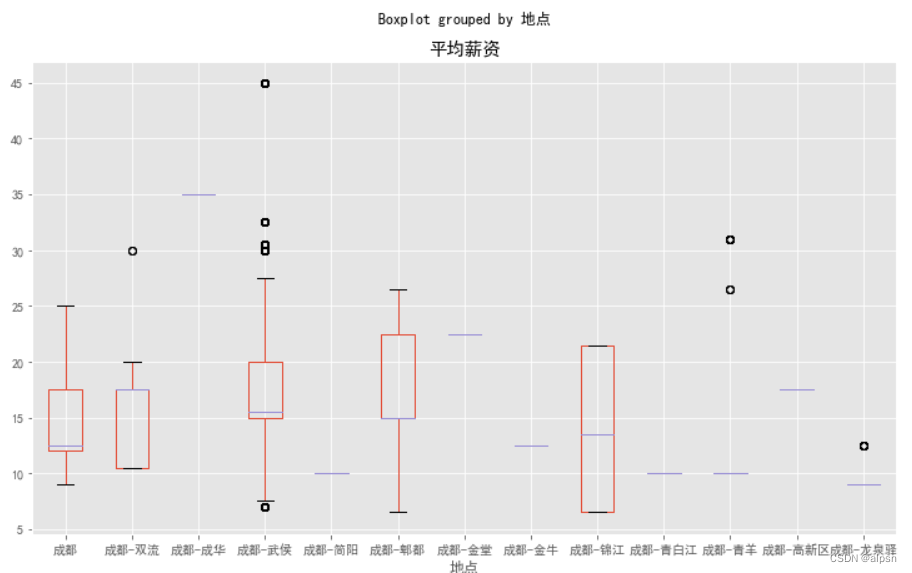
fig = plt.figure(figsize=(10,6))
df['学历'].value_counts().plot.pie(autopct='%1.0f%%')
plt.title('招聘学历占比')
plt.axis('equal') 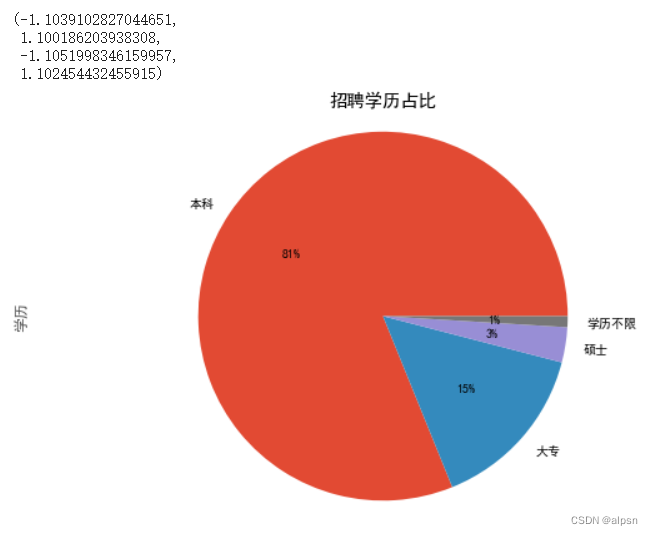
还有其他维度就不再展示了,可以自行进行分析。
4撰写数据报告
该阶段的的主要任务是:
1.明确目标:明确报告的目标和读者对象为大数据专业的应届生。
2.梳理数据:检查了数据是否存在异常值或缺失值,确保了数据来源可靠。
3.撰写报告:总结图表结论,为大数据专业的应届生提出就业建议,写出不足,获得的感悟以及课程反思 。


 2710
2710

 被折叠的 条评论
为什么被折叠?
被折叠的 条评论
为什么被折叠?
 到【灌水乐园】发言


