


Introduction
No matter you are a computer programmer or a user, I think you have seen the dialog to remind your application is crashed, and remind you to contact application vendor or report to Microsoft.
User only need reboot the device and report this issue to the service. For programmer, it is the horrific beginning, but don’t worry, this article will help you locate the position that causes the crash.
There are many articles to explain this, but I find they are out of date, for example Visual studio can’t support line numbers in the MAP file, so the old way that depends on the line number to locate the position isn’t feasible.
I will take VS2005 for example to introduce 2 new ways to locate the position of the exception:
1. Use MAP and cod file according to the exception address.
2. Use symbol and dump file (PDB, dump)
1. Using MAP and COD file
First of all, you'll need a MAP file. If you don't have one, it will be nearly impossible to find where your application crashed using the crash address. So first, I'll show you how to create a MAP file.

You only need set “Generate Map file” to “Yes”.
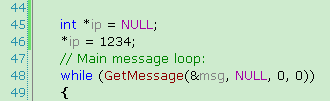
Now I write a simple code to cause the exception below:
int *ip = NULL;
*ip = 1234;
Obviously, it will cause an access violation exception.
It is the same with the other article’s description; An error box occurs and tell you the exception address.
In my program, it is “0x00011064”.
My map file is below (I only cite the necessary part):
exception
Timestamp is 4ad6ba58 (Thu Oct 15 13:59:52 2009)
Preferred load address is 00010000
Start Length Name Class
0001:00000000 00000d54H .text CODE
…
Address Publics by Value Rva+Base Lib:Object
0000:00000000 ___safe_se_handler_count 00000000 <absolute>
0000:00000000 ___safe_se_handler_table 00000000 <absolute>
0001:00000000 WinMain 00011000 f exception.obj
0001:000000d4 ?MyRegisterClass@@YAGPAUHINSTANCE__@@PA_W@Z 000110d4 f exception.obj
0001:00000184 ?InitInstance@@YAHPAUHINSTANCE__@@H@Z 00011184 f exception.obj
0001:000002f0 ?WndProc@@YAJPAUHWND__@@IIJ@Z 000112f0 f exception.obj
0001:00000564 ?About@@YAHPAUHWND__@@IIJ@Z 00011564 f exception.obj
…
Here, we still use the old way to locate the exception function first, the exception address is 0x00011064, it is in the between “0x00011000—WinMain” and “0x000110d4—MyRegisterClass”, so the exception is in the “WinMain”
Because from the visual studio 2003, linker doesn’t support “Line Number” in the map file, the old way that depends on the “Line Number” and “code segment” start address can’t work, we don’t use “Preferred load address” any more, here it is 0x00010000.
But we still need a offset, the entry address of WinMain is 0x00011000 and exception address is 0x00011064, so the offset is:
OFFSET = EXCEPTION ADDRESS – FUNCTION ENTRY ADDRESS = 0x00011064–0x00011000= 0x64
Now even we know the offset, but we still can’t use it to locate in the source codes, because this offset is calculate in the binary file.
We have to depend on some other information, in my way, it is COD file.In order to output the COD file, you also need do some set below:
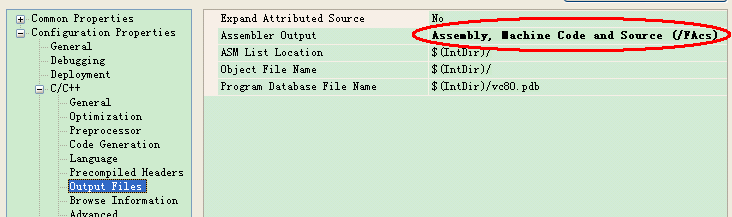
Then you will find some COD files, like stdafx.cod.
Here I also take a part of this file for example and add some comments in black to explain.
; 44 : //”; 44” indicates the line number in the soure code, your *.cpp file
; 45 : int *ip = NULL; //here you also can see the your C codes, it is in the line 45.
00050 e3a03000 mov r3, #0
00054 e58d3020 str r3, [sp, #0x20]
; 46 : *ip = 1234; //line number in the C codes, the following part between “;46” and “;47” they
//are the asm codes to implent the “*ip = 1234;”
00058 e59d2020 ldr r2, [sp, #0x20]
0005c e3a03b01 mov r3, #1, 22
00060 e38330d2 orr r3, r3, #0xD2
00064 e5823000 str r3, [r2]
00068 |$LN3@WinMain| //here you can see the 0x68, it is the offset
; 47 : // Main message loop:
; 48 : while (GetMessage(&msg, NULL, 0, 0))
00068 e3a03000 mov r3, #0
Now from this COD file, according to my comments, I think you can locate the line number of the source code. I repeat again:
The offset we calculated is 0x68, so we need check this line, it is “00068 |$LN3@WinMain|”, then we trace it is source number above, it is “;46”.
Until now, we have already located the exception position in the source codes.
Below is my source code, it is correct.
It is really a great and wonderful way. But please remember to backup these files: MAP and all the COD files.
2. Using Symbol and dump file
There is another easier way, but 2 files are necessary, one is PDB file of your executable program and the other is dump file.
PDB file is created after build and it should pair with executable file.
Dump file is created by OS, take WinCE for example, if you enable WER(Windows Error Reporting), there will be kdmp files created if unhandled exception occurs.
To analyze this, you can use Visual Studio or WinDbg tools, they can help us to locate the exception easily.
A. Using WinDbg
1. Open WinDbg, before open crash dump file, you need set the “Symbol file path…”, “Source file path…” and “Image file path…”

2. Open the dump file by “Open Crash Dump…”, then you will see the result immediately, like below, it will highlight the exception position of the source code.
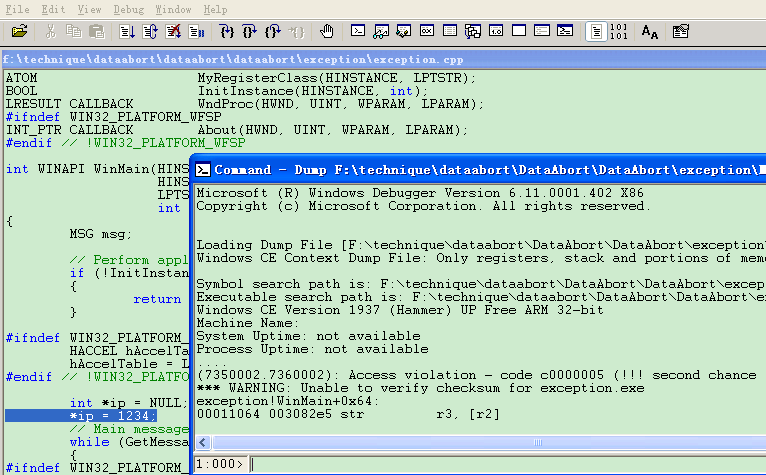
See, it is the same result with the one we analyze with MAP and COD file.
This way is more convenient than last one, we needn’t calculate at all, it can help us to locate automatically.
NOTE:
1. You must use the paired PDB and EXE files, or you may get the wrong result.
2. If you can’t get the code located, I think you set the wrong path I said in the Step1.
B. Using Visual Studio
With Visual Studio, we also can get the result quickly, it is the similar way to set.
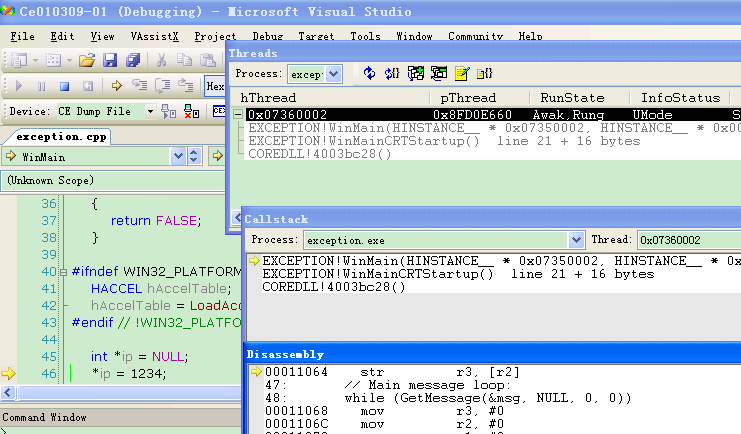
1. Open the dump file, here my dump file is ce010309.kdmp.
2. Set the “Source path mapping…” in the “Debug”, in my opinion, you’d better put the dump file, PDB file and source file in the same path, at least in the same disk partition, then you needn’t set this path, VS will set it itself. This will help you to avoid lots of troubles.
3. Choose “Target”à”Attach device”, then VS will run, you can see the “Callstack”, “Disassembly”, “Thread”, you can see others in the “Debug->window->…”.
Here I explain “Disassembly”, you can see “0x00011064 str r3, [r2]”, I think you can remember 0x00011064 is the exception address, VS locates it immediately, press right click of mouse on this line and choose “go to source”, then you will see the source code and it also indicates with a yellow arrow. It is the same result with WinDbg.
Summary
I hope you have realized that crash isn’t too horrific, isn’t it?
Keeping necessary PDB, MAP and COD files after every release can make the exception easier.But I also hope your program won’t crash. Design better, less trouble.
License
This article, along with any associated source code and files, is licensed under The Code Project Open License (CPOL)
About the Author
nicolas_chang


 106
106

 被折叠的 条评论
为什么被折叠?
被折叠的 条评论
为什么被折叠?
 到【灌水乐园】发言


