


%Velocity field and divergence of velocity etc.
%Parameter
vx0 = 10.^(-9)
%vy0 = 10.^(-9)
%Tune scale of vyo in order to div(v) towards zero(five mangitudes)
vy0 = vx0./0.33333
%set gird
[x,y] = meshgrid(0:10000:1000000,0:10000:1500000)
[x1,y1] = meshgrid(0:100000:1000000,0:100000:1500000)
W = max(max(x))
H = max(max(y))
%msgbox(num2str(W), 'value of variable W', 'modal');
%msgbox(num2str(H), 'value of variable H', 'modal');
%field
velocity_x = -vx0*sin(2*pi*x./W).*cos(pi*y./H)
velocity_y = vy0*cos(2*pi*x./W).*sin(pi*y./H)
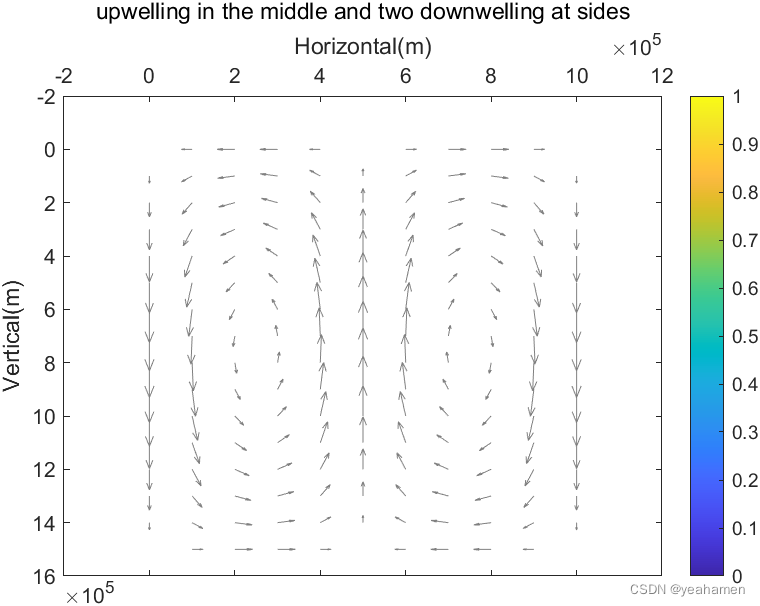
velocity_x_arrow = -vx0*sin(2*pi*x1./W).*cos(pi*y1./H)
velocity_y_arrow = vy0*cos(2*pi*x1./W).*sin(pi*y1./H)
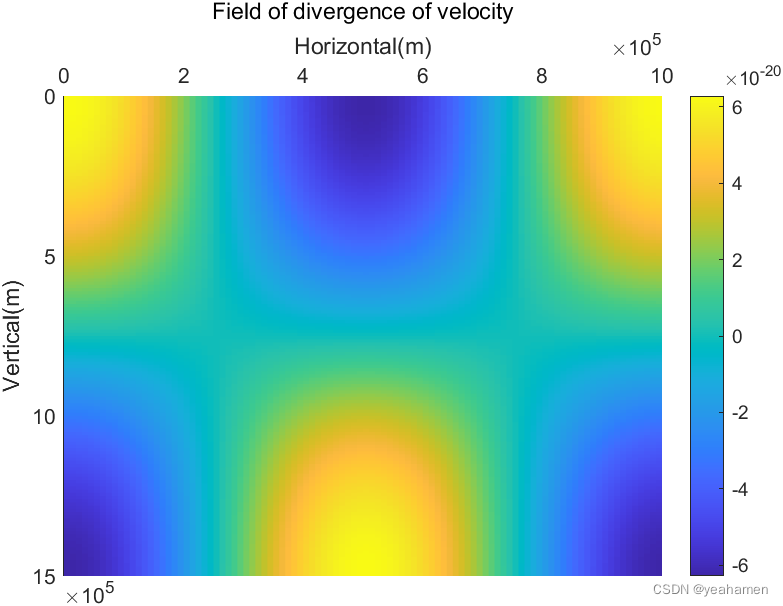
x_derivative_of_velocity_x = -vx0*cos(pi*y./H).*(2*pi./W).*cos(2*pi*x./W)
y_derivative_of_velocity_y = vy0*cos(2*pi*x./W).*cos(pi*y./H).*(pi./H)
divergence_of_velocity = x_derivative_of_velocity_x + y_derivative_of_velocity_y
%x compontent of velocity
figure(1)
pcolor(x,y,velocity_x)
xlabel('Horizontal(m)')
ylabel('Vertical(m)')
title('Field of velocity x compontent of velocity')
set(gca,'xaxislocation','top');
%Two means of change axs' location
%ax = gca;
%ax.XAxisLocation = 'top'
set (gca,'YDir','reverse')
shading flat
colorbar
%y compontent of velocity
figure(2)
pcolor(x,y,velocity_y)
xlabel('Horizontal(m)')
ylabel('Vertical(m)')
title('Field of velocity y compontent of velocity')
set(gca,'xaxislocation','top');
set (gca,'YDir','reverse')
shading flat
colorbar
%x_derivative_of_velocity_x
figure(3)
pcolor(x,y,x_derivative_of_velocity_x)
xlabel('Horizontal(m)')
ylabel('Vertical(m)')
title('Field of x derivative of velocity x')
set(gca,'xaxislocation','top');
set (gca,'YDir','reverse')
shading flat
colorbar
%y_derivative_of_velocity_y
figure(4)
pcolor(x,y,y_derivative_of_velocity_y)
xlabel('Horizontal(m)')
ylabel('Vertical(m)')
title('Field of y derivative of velocity y')
set(gca,'xaxislocation','top');
set (gca,'YDir','reverse')
shading flat
colorbar
%divergence of velocity
figure(5)
pcolor(x,y,divergence_of_velocity)
xlabel('Horizontal(m)')
ylabel('Vertical(m)')
title('Field of divergence of velocity')
set(gca,'xaxislocation','top');
set (gca,'YDir','reverse')
shading flat
colorbar
%modeling mantle flow
figure(6)
scale = 1
quiver(x1,y1,velocity_x_arrow,velocity_y_arrow,scale,'Color',[0.5 0.5 0.5])
xlabel('Horizontal(m)')
ylabel('Vertical(m)')
title('upwelling in the middle and two downwelling at sides')
set(gca,'xaxislocation','top');
set (gca,'YDir','reverse')
shading flat
colorbar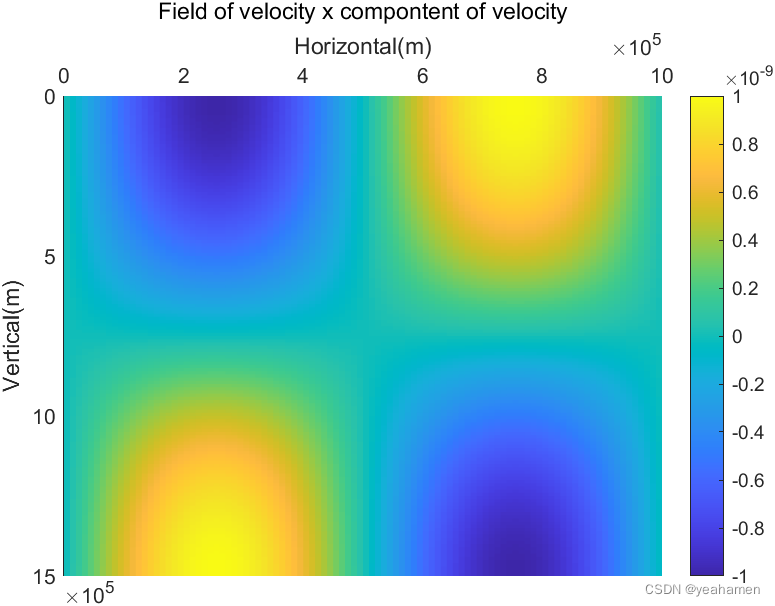


 3269
3269


 被折叠的 条评论
为什么被折叠?
被折叠的 条评论
为什么被折叠?
 到【灌水乐园】发言


